


Gold Price (XAU/USD), Chart, and Analysis
- Gold respects multi-week support.
- The daily gold chart offers something for everyone.
- Retail trader data remains mixed.

For all market-moving data releases and events, see the DailyFX Economic Calendar.
Gold Price Update – Grinding Into Multi-Week Support
Gold tested a noted level of support at the end of last week but failed to break lower as US Treasury yields fell throughout the session. The support level – around $1,786/oz. – proved robust and the precious metal ended the session in positive territory, leaving a bullish hammer candlestick on the chart. This candle formation usually suggests a bullish turnaround, especially if preceded by a bearish trend.
Trading the Bullish Hammer Candle
The daily chart also shows a negative moving average crossover, a ‘death cross’ was made in the middle of June. This crossover, when the 5-day sma crosses below the 200-day sma, is often quoted by technical traders as a market negative as it shows short-term price momentum moving lower.
Death Cross: What is it and How to Identify it When Trading
With the US closed today to celebrate Independence Day, turnover across all markets is likely to be limited. Gold looks set to trade within a $1,786/oz. to $1.840/oz. range in the short-term with US Treasury yields the likely driver of the next move. 10-year UST yields are now 60basis points below their recent high of 3.48%, as fears of a recession in the US increase. Financial markets are now pricing-in US rate cuts by the middle of 2023, easing the pressure on the precious metal. Before then, the Federal Reserve will continue to hike rates aggressively to counter soaring inflation, a negative for gold. For the time being, gold may well be setting up a trading range, a potential boon for traders.
{{THE_FUNDAMENTALS_OF_RANGE_TRADING}}
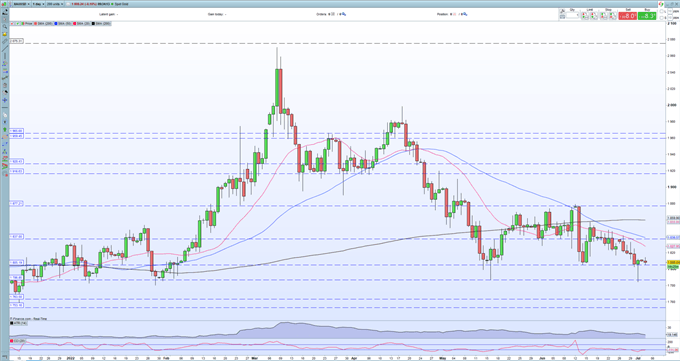
Gold Daily Price Chart – July 4, 2022
Trade Smarter - Sign up for the DailyFX Newsletter
Receive timely and compelling market commentary from the DailyFX team
Retail trader data show 84.56% of traders are net-long with the ratio of traders long to short at 5.47 to 1. The number of traders net-long is 1.34% higher than yesterday and 3.95% higher from last week, while the number of traders net-short is 9.57% higher than yesterday and 5.02% lower from last week.
We typically take a contrarian view to crowd sentiment, and the fact traders are net-long suggests Gold prices may continue to fall. Positioning is less net-long than yesterday but more net-long from last week. The combination of current sentiment and recent changes gives us a further mixed Gold trading bias.
| Change in | Longs | Shorts | OI |
| Daily | 4% | 1% | 3% |
| Weekly | -8% | 4% | -3% |
What are your views on Gold – bullish or bearish?? You can let us know via the form at the end of this piece or you can contact the author via Twitter @nickcawley1.


