


Bitcoin Forecast:
- Bitcoin remains vulnerable to economic data, FOMC minutes loom
- BTC/USD consolidates between key technical support and resistance
- Cryptocurrency benefit from the US holiday but face a tough week ahead

Bitcoin prices lack momentum ahead of FOMC
After a tumultuous Q2, Bitcoin has entered Q3 with lackluster motion as prices continue to consolidate around the $20,000 mark.
Since the beginning of the year, heightened geopolitical risks and a shift in sentiment (caused by rate hikes, war and a gloomy economic outlook) has weighed on digital assets, driving Bitcoin back towards levels last seen in December 2020.
Visit the DailyFX Educational Center to discover how macro fundamentals impact markets
As illustrated on the weekly chart below, BTC/USD has often experienced large price swings, gaining traction once a clear direction has formed. By using Fibonacci levels from historical moves, both technical and psychological levels have provided support and resistance over time, often assisting in fueling momentum once these levels are broken..

After falling below $18,000 on June 18th, bears were able to drive prices to $17,592 in an effort to retest the December 2020 low at $17,569. Failure to break below this level allowed buyers to drive prices higher before running into a wall of resistance at $21,000. While bulls and bears continue to trade side-ways, the weekly RSI (Relative Strength Index) has fallen below 30, threatening oversold territory.
Bitcoin (BTC/USD) Weekly Chart
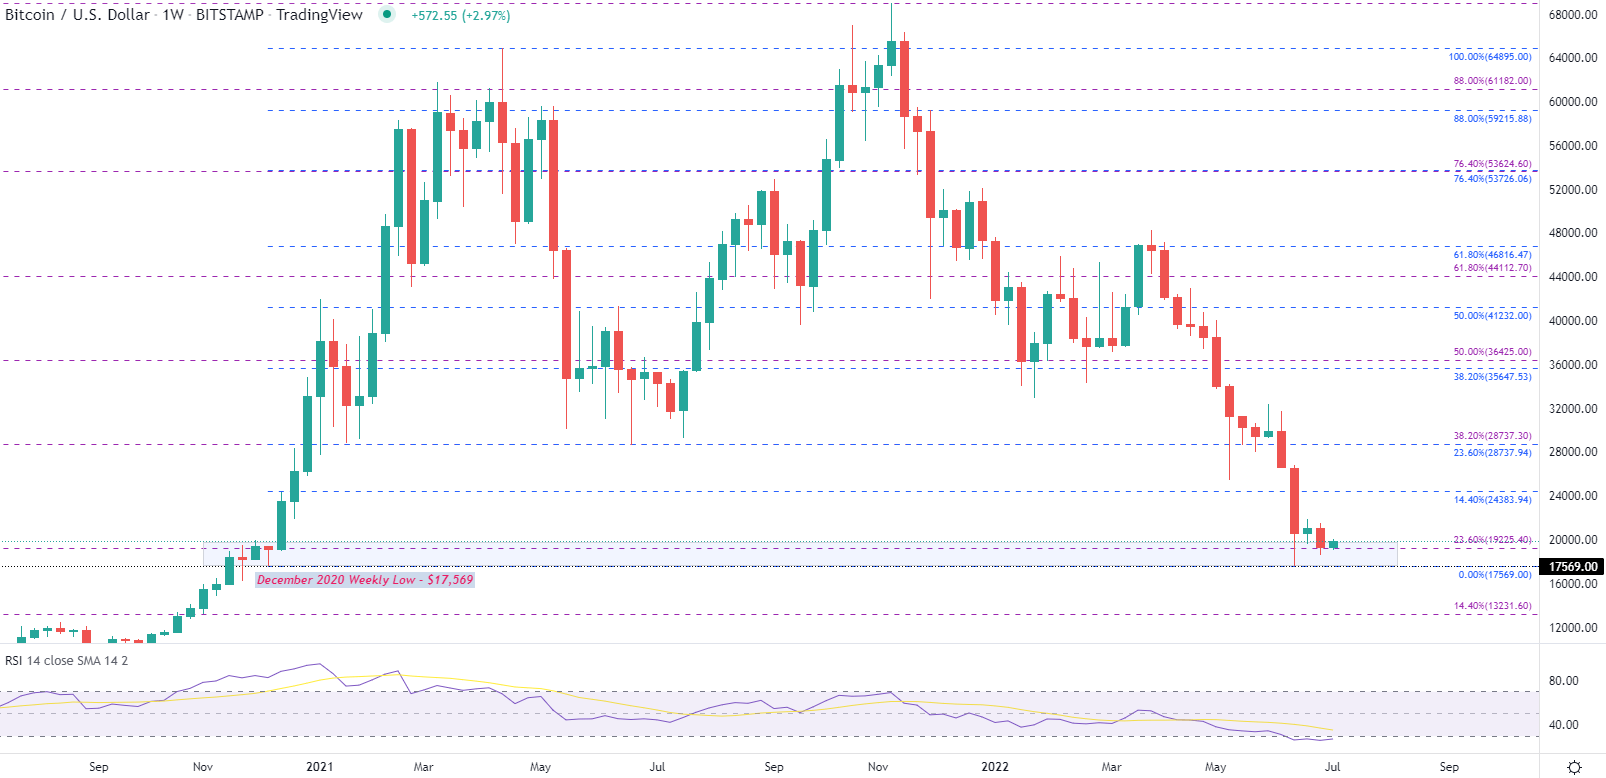
Source: TradingView, Chart by Tammy Da Costa
With a negative correlation existing between BTC/USD and interest rates, mounting price pressures and an influx of stimulus (throughout the Covid-19 pandemic) has forced the Federal Reserve to raise rates more aggressively than initially expected, reducing the appeal of speculative assets.
As the projected economic growth outlook remains rather bleak, Bitcoin prices have celebrated the US holiday in the green, treading cautiously just above $19,000. With the FOMC Minutes and NFP data on this week’s economic docket, fundamentals may assist in driving prices out of the $18,000 - $22,000 range.
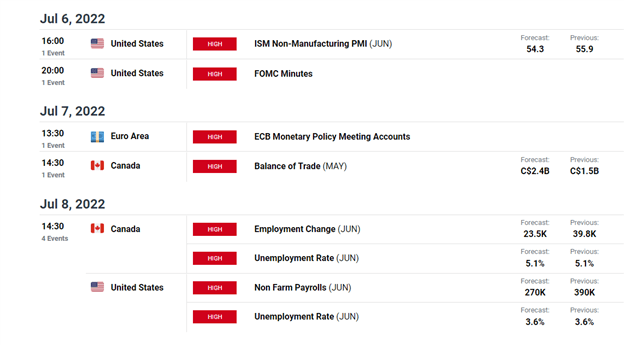
DailyFX Economic Calendar
Meanwhile, on the Daily chart, the $19,225 Fib has provided an additional layer of support with a break below $19,000 opening the door for a retest of the June low at $17,592. If both these levels are broken, increased selling pressure may allow for a break towards 14.4% Fib at $13,321.
Bitcoin (BTC/USD) Daily Chart
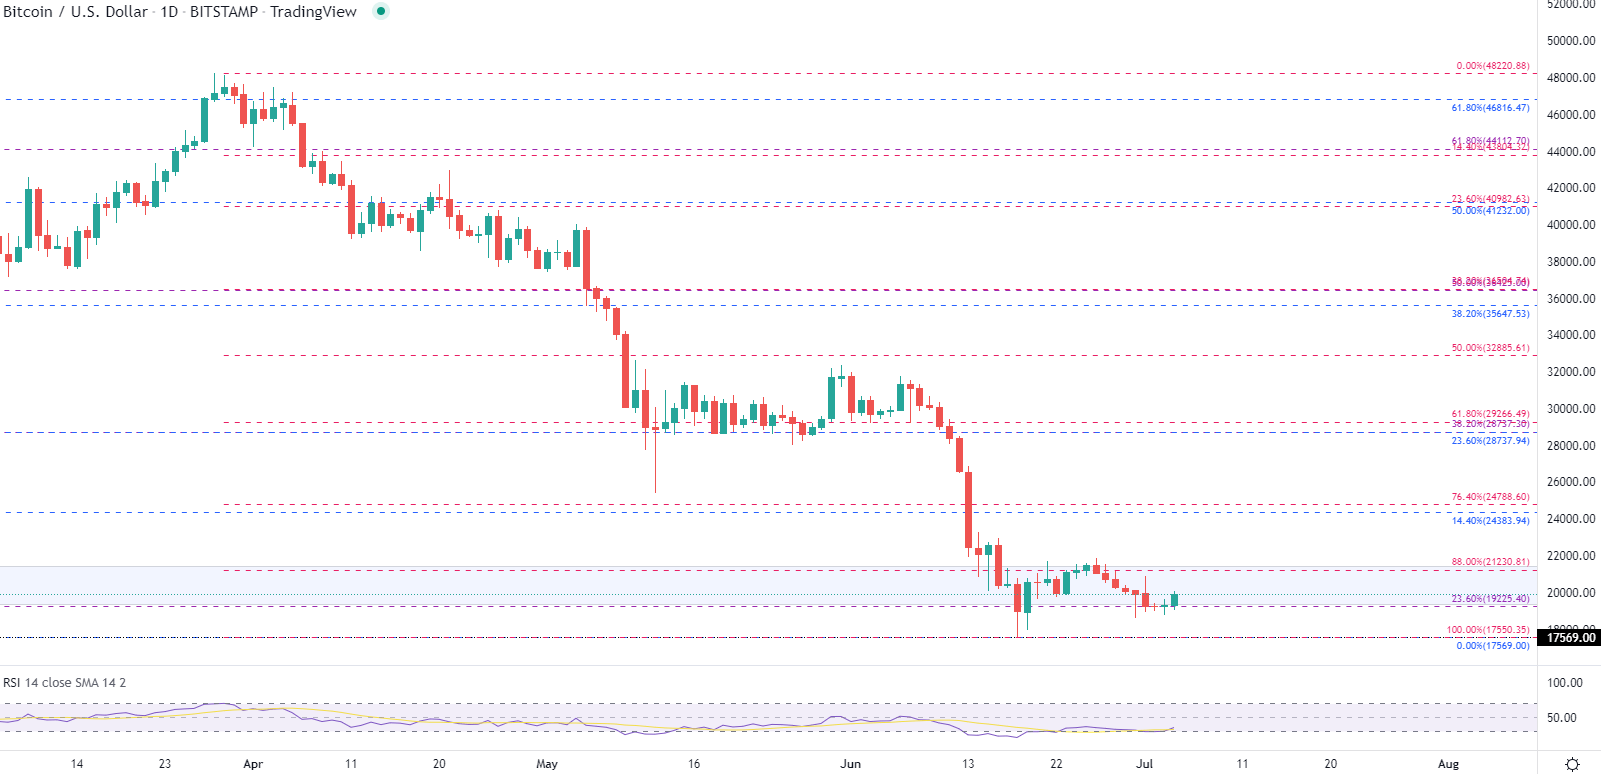
Source: TradingView, Chart by Tammy Da Costa
--- Written by Tammy Da Costa, Analyst for DailyFX.com
Contact and follow Tammy on Twitter: @Tams707


