


Bitcoin (BTC) Technical Outlook
- Bitcoin prices benefit from slight boost in sentiment but range-bound motion holds
- BTC/USD remains bound by both Fibonacci and psychological support and resistance
- Chart patterns that have formed from historical moves highlight important technical levels

China Eases Covid-19 Restrictions, Bitcoin Gains
Risk assets have edged slightly higher after China announced an easing of Covid-19 restrictions that has had a major impact on business productivity and economic growth.
Visit the DailyFX Educational Center to discover how macro fundamentals impact markets
Although the boost in sentiment allowed Bitcoin to remain above $20,000, the tight range that has been discussed in detail over the past few weeks continues to hold, as prices whipsaw between $18,000 and $22,000 respectively.
While it would be naïve to ignore the fundamental factors that have played a major role in the recent capitulation of stocks and crypto’s, large price swings have highlighted the role of speculation and crowd psychology in markets and the manner in which technical levels may assist in identifying important areas of support and resistance.
Introduction to Technical Analysis
Learn Technical Analysis
Recommended by Tammy Da Costa
Bitcoin Technical Levels
Since peaking in November 2021, Bitcoin prices fell by approximately 74% before rebounding off of $17,567 on June 18th. As Ethereum (ETH/USD) and alt-coins followed suit, the sharp decline in digital assets that wiped out approximately $2 Trillion from the total market capitalization since the all-time high, hasn’t been the first to take the industry by storm.
For those who may recall, the major crypto experienced a similar 70% decline from the 2017 high – 2018 low and an approximate 55% decline from the April 2021 high to the June 2021 low with distinctive chart patterns forming over time.
As illustrated on the daily chart below, the bearish momentum that fueled the steep decline has been temporarily muted with prices hovering in the narrow range mentioned above. With major Fibonacci levels forming confluent zones, key psychological levels and the 10-day Moving Average could provide an additional catalyst for price action.

Bitcoin Daily Chart

Source: TradingView, Chart by Tammy Da Costa
Taking a closer look, the four-hour chart further highlights the range-bound motion, as both bulls and bears search for a fresh bout of momentum.
Bitcoin 4-Hour Chart
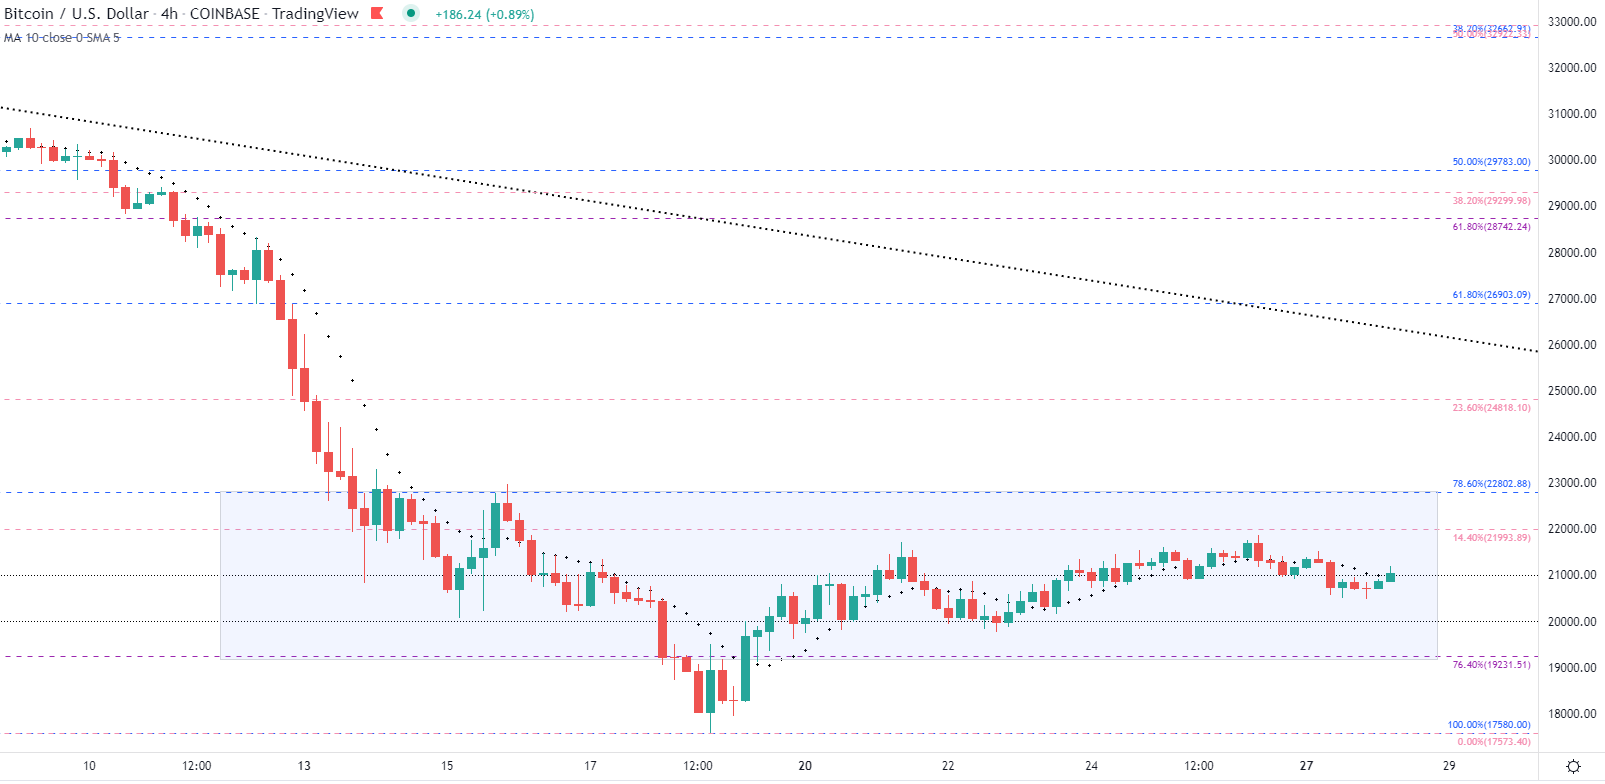
Source: TradingView, Chart by Tammy Da Costa
Currently, the support levels that may come into play include:
- S1: $20,000 (Key psych level)
- S2: $19,231 (76.4% Fib of the 2020 – 2021 move)
- S3: $18,000
Contrary to this, resistance levels include:
- R1: $21,993 (14.4% Fib of the March – June 2022 move)
- R2: $22,000
- R3: $24,000

--- Written by Tammy Da Costa, Analyst for DailyFX.com
Contact and follow Tammy on Twitter: @Tams707


