


US Dollar Daily Price and Analysis

The US dollar is taking a break from its recent surge, allowing a range of other currencies the chance to pull back some of their losses against the greenback. The US dollar’s fundamentals remain strong with next week’s FOMC meeting the starting point for a series of 50 basis point rate hikes and quantitative tightening. Thursday’s Q1 GDP was disappointing but the headline number (-1.4% vs +1.1% forecast) was heavily skewed by inventories. Today sees the latest look at US inflation – Core PCE – at 12.30 GMT and this will lead the greenback going into the weekend.
US First Quarter GDP Shrinks 1.4%, S&P 500 Holds Gains but Uncertainty Rises
For all market-moving economic data and events, see the DailyFX Calendar.
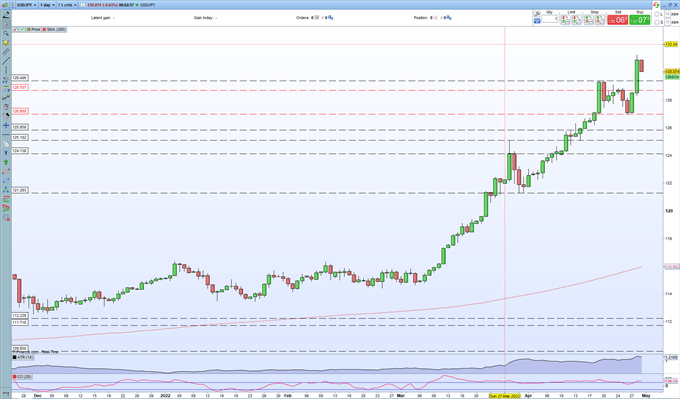
One currency pair that has weakened noticeably over the last few weeks is USDJPY due to the different monetary policy stances of the two central banks. While the US is tightening, and tightening hard, the Bank of Japan continues with its ultra-loose policy to try and promote domestic growth and import inflation. After breaking above 130.00 the pair traded as high as 131.30 yesterday before fading lower today. Short-term support at 129.41 should hold.
Trade Smarter - Sign up for the DailyFX Newsletter
Receive timely and compelling market commentary from the DailyFX team
USDJPYDaily Price Chart – April 29, 2022
| Change in | Longs | Shorts | OI |
| Daily | -2% | 2% | 0% |
| Weekly | 12% | -16% | -6% |
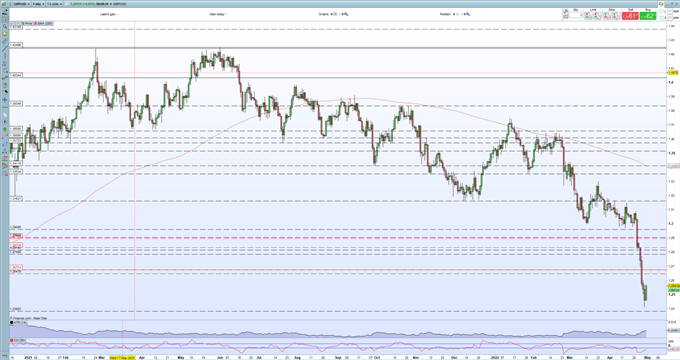
GBP/USD is picking itself up off the floor after Thursday’s battering which pushed cable down to just above 1.2400, a fresh 22-month low. The pair have picked up today, again due to a bout of US dollar weakness, but the severity of the recent move lower may mean further gains are slow and limited. Overhead resistance between 1.2648 and 1.2675 should cap any short-term rally.
GBP/USD Daily Price Chart – April 29, 2022
| Change in | Longs | Shorts | OI |
| Daily | 3% | -7% | -3% |
| Weekly | 4% | -10% | -5% |
What is your view on the US Dollar – bullish or bearish?? You can let us know via the form at the end of this piece or you can contact the author via Twitter @nickcawley1.


