


FIRST QUARTER GDP KEY POINTS:
- U.S. economic activity contracts1.4% in annualized terms during the first quarter, disappointing expectations
- A negative contribution from net exports and inventories explains the GDP decline
- The S&P 500 futures maintains gains
Trade Smarter - Sign up for the DailyFX Newsletter
Receive timely and compelling market commentary from the DailyFX team
Most read: Energy Stocks Look Attractive on Soaring Oil - Top Trade Opportunities
The U.S. economy hit the brakes and downshifted abruptly during the first three months of the year, marking a sharp turnaround from the robust 6.9% expansion recorded at the end of 2021. According to the Department of Commerce, first-quarter gross domestic product, the broadest measure of goods and services produced in the country, fell 1.4% on an annualized basis, the first contraction since the onset of the COVID-19 pandemic in 2020. Economists surveyed by Bloomberg News had forecast a 1.1% increase in output during this period.
In the grand scheme of things, the economic setback can be attributed to the familiar headwinds that have plagued the economy recently, such as the Omicron wave earlier this year, the Russian invasion of Ukraine, high inflation, and persistent supply chain bottlenecks.
Looking at the component breakdown, the negative headline GDP reading largely reflected weakness in trade and investment. For instance, the external sector subtracted 3.2% from output after imports surged 17.7% as firms front-loaded orders in anticipation of potential shortages following the outbreak of war in Eastern Europe. Exports, for its part, tank 5.9% amid strong U.S. dollar and dwindling demand from abroad. Meanwhile, gross private domestic investment was subdued, up only 2.3%, constrained by private inventories, which knocked off 0.84 percentage point from GDP - a largely anticipated development after businesses had already materially restocked their shelves at the tail end of 2021 to get ahead of supply chain and logistical issues before the holidays.
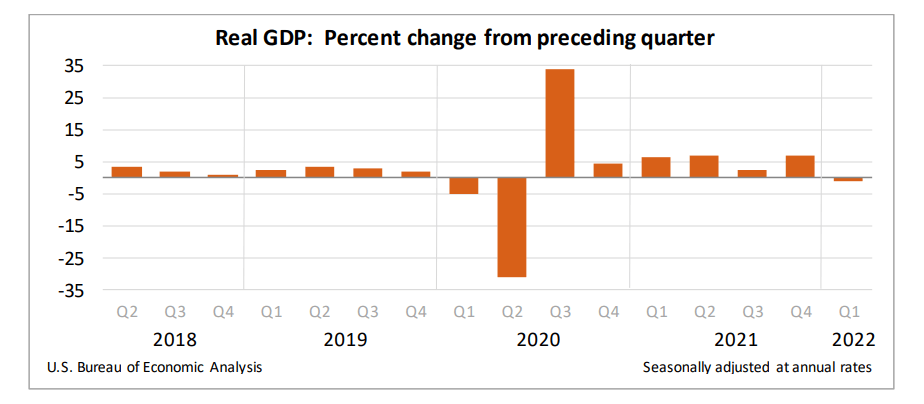

Separately, personal consumption expenditures, which account for more than two-thirds of economic activity, advanced 2.7%, following a 2.5% increase in the prior period, a sign that consumer spending remains healthy, bolstered by low unemployment levels, robust wage gains, and leftover savings from trillions of dollars in fiscal stimulus doled out by the government to support the recovery in the wake of the health crisis. With no significant pullback in household outlays despite soaring inflation and depressed confidence levels, the probability of a recession, defined as two consecutive quarters of output contraction, is not extremely high yet.
S&P 500 futures whipsawed, but maintained gains in the pre-market session after the GDP report crossed the wires. While today’s figures are backward looking, the data miss may not be a reason to panic as the contraction was caused by the negative net exports and inventories contribution, rather than cooling spending. On that note, it appears the U.S. consumer has managed to absorb price increases and, more importantly, continues to be resilient. With consumption still firm and businesses poised to continue rebuilding their depleted inventories, Q2 GDP should bring better news, allowing the Fed to press ahead with its plans to remove policy accommodation forcefully.
| Change in | Longs | Shorts | OI |
| Daily | 1% | -1% | 0% |
| Weekly | 15% | -13% | -1% |
S&P 500 FUTURES 5-MINUTES CHART
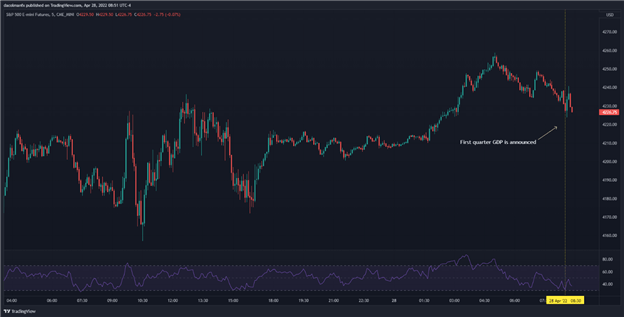
S&P 500 E-Mini Futures Chart Prepared Using TradingView
EDUCATION TOOLS FOR TRADERS
- Are you just getting started? Download the beginners’ guide for FX traders
- Would you like to know more about your trading personality? Take the DailyFX quiz and find out
- IG's client positioning data provides valuable information on market sentiment. Get your free guide on how to use this powerful trading indicator here.
---Written by Diego Colman, Contributor


