


S&P 500, Nasdaq 100 Prices, Charts, and Analysis
- Bear market rallies seen in S&P 500 and Nasdaq 100.
- Thursday could see heightened volatility on Q1 earnings and US GDP releases.

The US stock markets are pulling back some on Tuesday’s heavy losses in early European trade with the S&P 500 around 60 points higher than yesterday’s close, while the Nasdaq 100 is 300 points above Tuesday’s nadir. Increasing fears that the Fed’s hawkish monetary policy may hit US growth hard in the coming months, as interest rate hike expectations continue to bite, and some worrying corporate earnings releases have sent US indices tumbling. The S&P 500 printed a fresh five-week low on Tuesday while the Nasdaq 100, already in bear market territory, traded at its lowest level seen since March 2021. Both pullbacks look like traditional bear market rallies that are normally seen after heavy sell-offs, and lower prices are likely going forward.
S&P 500, Nasdaq 100 Weekly Forecasts – Bond Yields Hammer Equity Sentiment
Trade Smarter - Sign up for the DailyFX Newsletter
Receive timely and compelling market commentary from the DailyFX team
While the current outlook remains gloomy, there are a couple of high-importance Q1 earnings releases and the latest look at US growth and inflation that may make or break the current move. On Thursday, the US Bureau of Economic Analysis will release the advanced US Q1 GDP report with q/q growth seen contracting sharply in the first three months of 2022 to 1.1% compared to last quarter’s 6.9%. A notable beat or miss in tomorrow’s data will add extra volatility to an already highly volatile equity complex. In addition to the GDP data, on Friday the Fed’s favored measure of price pressure, Core PCE, is released with inflation expected to have slowed by just 0.1% to 5.3% y/y in March.
For all market-moving data releases and events, see the DailyFX Economic Calendar
On Thursday’s US Q1 corporate earnings docket, a wide range of high-profile companies will release their latest quarterly figures. After tomorrow’s closing bell however there are two names that demand attention, Apple (AAPL) and Amazon (AMZN). Apple is the S&P 500s largest constituent by weighting (7.1%), while Amazon is the third-largest (3.7%). In the Nasdaq 100, these weightings are even higher with Apple at 12.8% and Amazon at 7.15%. As with the US GDP and PCE releases, any beat or miss of expectations will have an outsized effect on both indices.
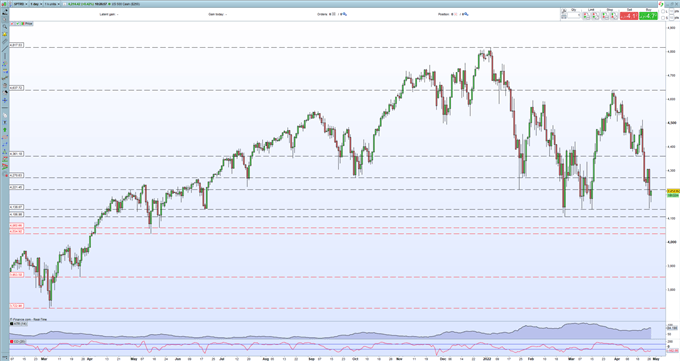
The S&P 500 respected the March double-low at 4,138 yesterday and while this may well hold in the short-term the aggressive sell-off over the last month suggests that it will be tested again. Below, 4,106 guards older horizontal support at 4,060 and 4,034. Any upside move will find initial resistance at 4,308.
S&P 500 Daily Price Chart – April 27, 2022
| Change in | Longs | Shorts | OI |
| Daily | 1% | -1% | 0% |
| Weekly | 15% | -13% | -1% |
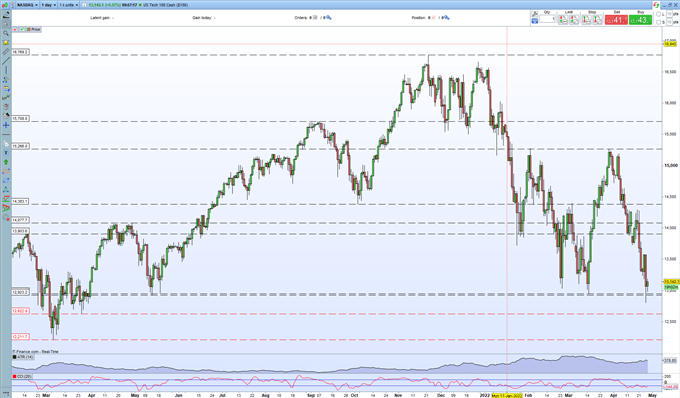
The Nasdaq 100 daily chart remains bearish and Tuesday’s test of 12,923 looks set to be repeated in the current environment. Volatility, measured by the ATR indicator leaves 12,623 and 12,212 vulnerable.
Nasdaq 100 Daily Price Chart – April 27, 2022
What is your view on the US Equity Markets – bullish or bearish?? You can let us know via the form at the end of this piece or you can contact the author via Twitter @nickcawley1.


