


Gold Price (XAU/USD), Chart, and Analysis
- Safe haven flows override concerns of higher rates.
- A sharp increase in retail net-shorts over the week.

Fears that Russia could invade Ukraine imminently have driven safe-haven flows into gold, pushing the price of the precious metal back to levels last seen in late November. Friday’s $40 rally saw gold hit $1,865/oz. before edging marginally lower as UK intelligence warned that Russia could invade Ukraine ‘at any time’, while US President Joe Biden warned Russia that the US would react swiftly if Russia entered Ukraine. As conditions worsen, gold continues to pick up a strong risk-off bid and this is likely to remain the case for the foreseeable future.
Gold traders should also be aware that there are a number of Fed members speaking this week, including St. Louis Fed President James Bullard who speaks today at 13:30 GMT. Bullard’s hawkish turn last week, suggesting 100 basis points of rate hikes before July 1, sent short-end US government bond yields spiraling higher with the rates market now looking at seven standard 0.25% rate increases this year. There is also increasing talk of a 50 basis point hike at the March FOMC meeting and, to a lesser degree, a special inter meeting hike before then. Normally the higher inflation/higher rates environment would weigh heavily on gold but the political background is currently holding sway.
For all market-moving data releases and events, check out the DailyFX Calendar
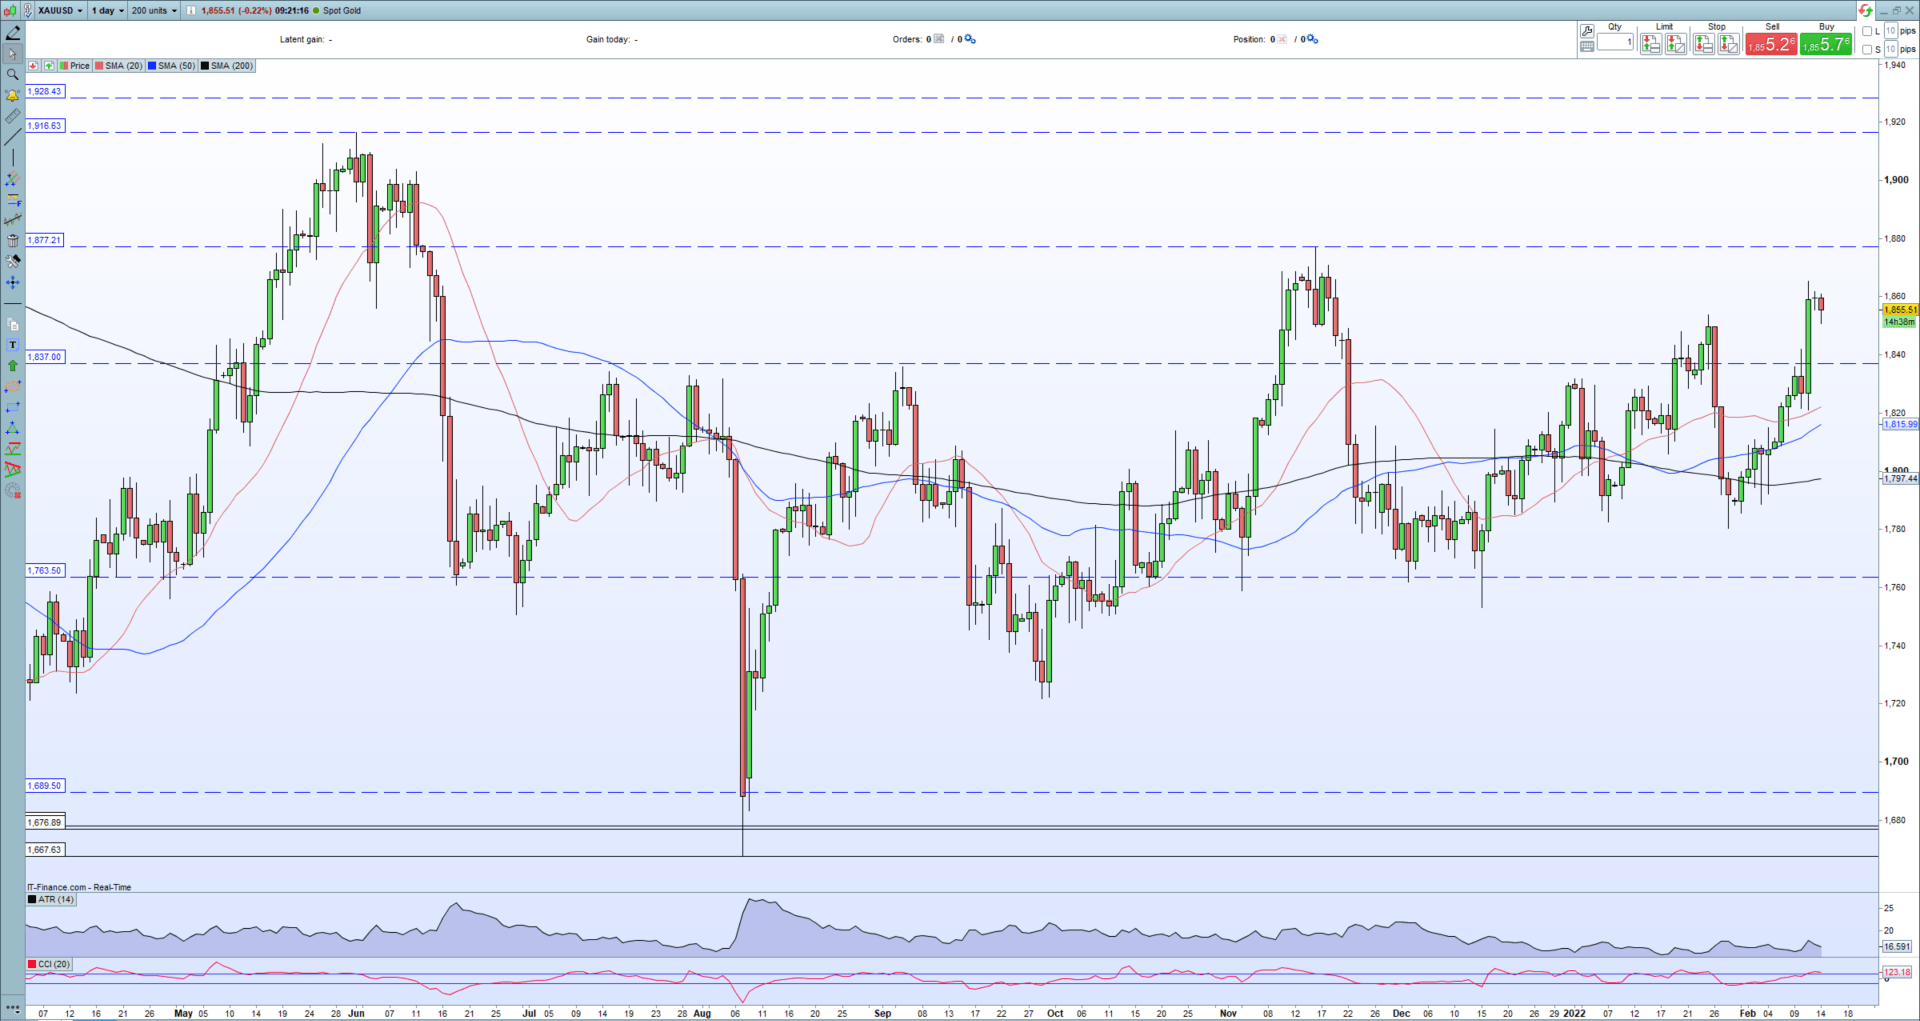
With gold back above the prior resistance area of $1,830/$1,837/oz. the next target in sight is the November 16 high at $1,877/oz. The series of higher lows from early August remain in place and underpin the move higher, while all three simple moving averages remain supportive.
Gold Daily Price Chart – February 14, 2022
Trade Smarter - Sign up for the DailyFX Newsletter
Receive timely and compelling market commentary from the DailyFX team
Retail trader data show 67.51% of traders are net-long with the ratio of traders long to short at 2.08 to 1. The number of traders net-long is 5.51% higher than yesterday and 18.27% lower from last week, while the number of traders net-short is 5.67% higher than yesterday and 67.85% higher from last week.
We typically take a contrarian view to crowd sentiment, and the fact traders are net-long suggests Gold prices may continue to fall. Yet traders are less net-long than yesterday and compared with last week. Recent changes in sentiment warn that the current Gold price trend may soon reverse higher despite the fact traders remain net-long.

What is your view on Gold – bullish or bearish?? You can let us know via the form at the end of this piece or you can contact the author via Twitter @nickcawley1.


