


NFP, Non-farm Payrolls, USD Talking Points:
- This morning brought the release of Non-farm Payrolls for the month of January.
- Expectations were very low after the earlier-week ADP report showed a contraction of 307k versus an expectation for a gain of 201k.
- The analysis contained in article relies on price action and chart formations. To learn more about price action or chart patterns, check out our DailyFX Education section.

This morning brings the release of Non-farm Payrolls out of the United States, and the bar is set incredibly low. This is a live article, meaning that it’ll be updated around the event, with each update denoted by the time in which it was added ahead of that specific entry.
9:26
US Equities Primed for a Significant Test
This will be the last update for this month’s NFP coverage from DailyFX. If you’d like to see the prior updates, simply scroll down and each is denoted with a time stamp for when that update took place.
We’re about ten minutes ahead of the US equity open and the Nasdaq 100 is already putting in a significant support test.
Such an environment can be an excellent opportunity to get a read for sentiment. Last night’s earnings reports released after the bell brought a huge move in after-hours trade to AMZN, SNAP and even PINS. These tech companies all had some bright spots to report in their earnings calls and accordingly the stocks jumped in that low-liquidity backdrop. The size of the gains is what stands out: At one point AMZN was up by 17%, SNAP up by more than 50% and PINS up 29% - and these are all multi-billion dollar companies trading more like a crypto currency than a blue chip.
But, this morning’s NFP report highlights a strong labor market and that can leave the door open for more aggressive tightening from the Fed, reflected in probabilities for a 50 basis point hike at the March rate decision, which just jumped up to 27.9% after going as low as 6% earlier in the week.
Rate Probabilities for March FOMC Rate Decision

Chart prepared by James Stanley; data from CME Fedwatch
Nasdaq Support Test
The Nasdaq 100 is putting in a bounce ahead of the open at the 14,375 spot. A breach of this level opens the door for next supports at 14,243, 14059 and 13900.
Nasdaq 100 Hourly Price Chart
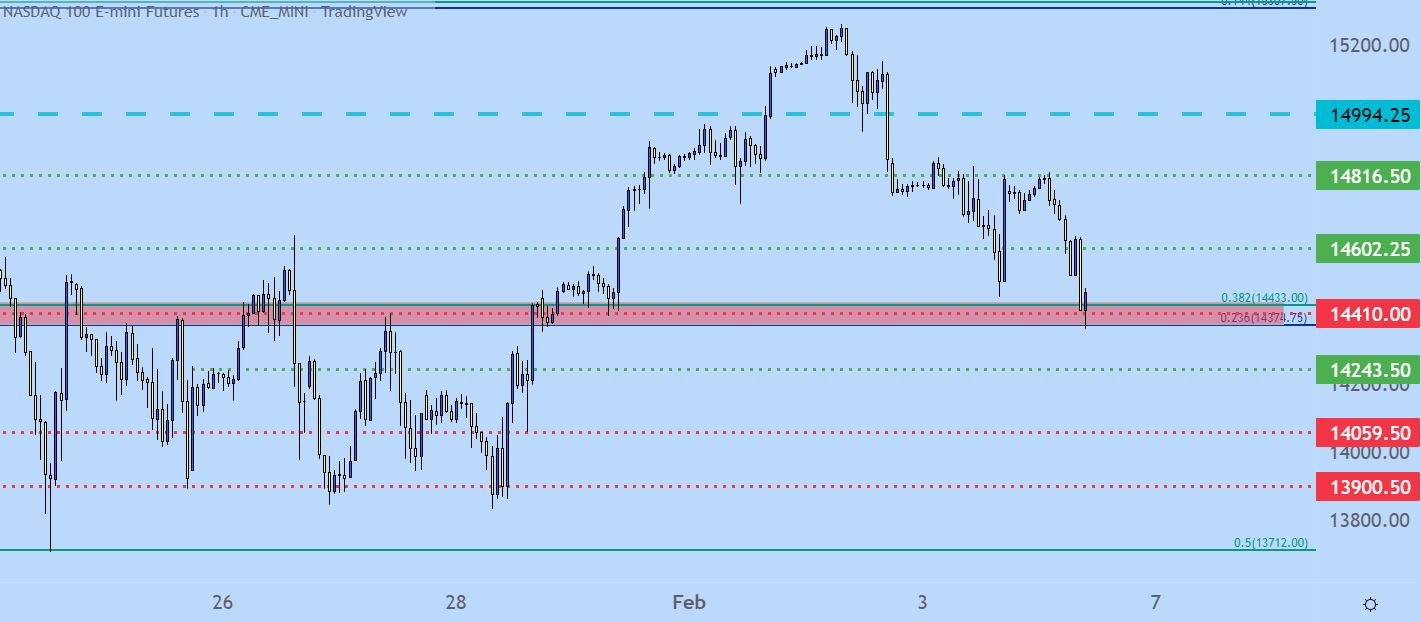
Chart prepared by James Stanley; Nasdaq 100 on Tradingview
9:10
Stocks starting to fall out of bed here. The Nasdaq 100 has already pushed down to key support at the 14,375 area, and the S&P 500 is getting on with the move, as well.
Next supports in SPX are at 4429, 4380, 4328, 4304 and if those all give way, especially today, we could be in for a wild ride.
S&P 500 Hourly Price Chart

Chart prepared by James Stanley; S&P 500 on Tradingview
9:01
The US Dollar is continuing to rally off of this print as the release smashed expectations, even the diminished expectations that were floating around this week, with some even going so far as to suggest that this would print in negative territory. The US Dollar is now coming off of that oversold reading and there’s a major spot ahead on the chart, taken from prior support at the Fibonacci level of 95.86. This could be attractive for that next spot of short-term resistance in the USD.
US Dollar Four-Hour Price Chart
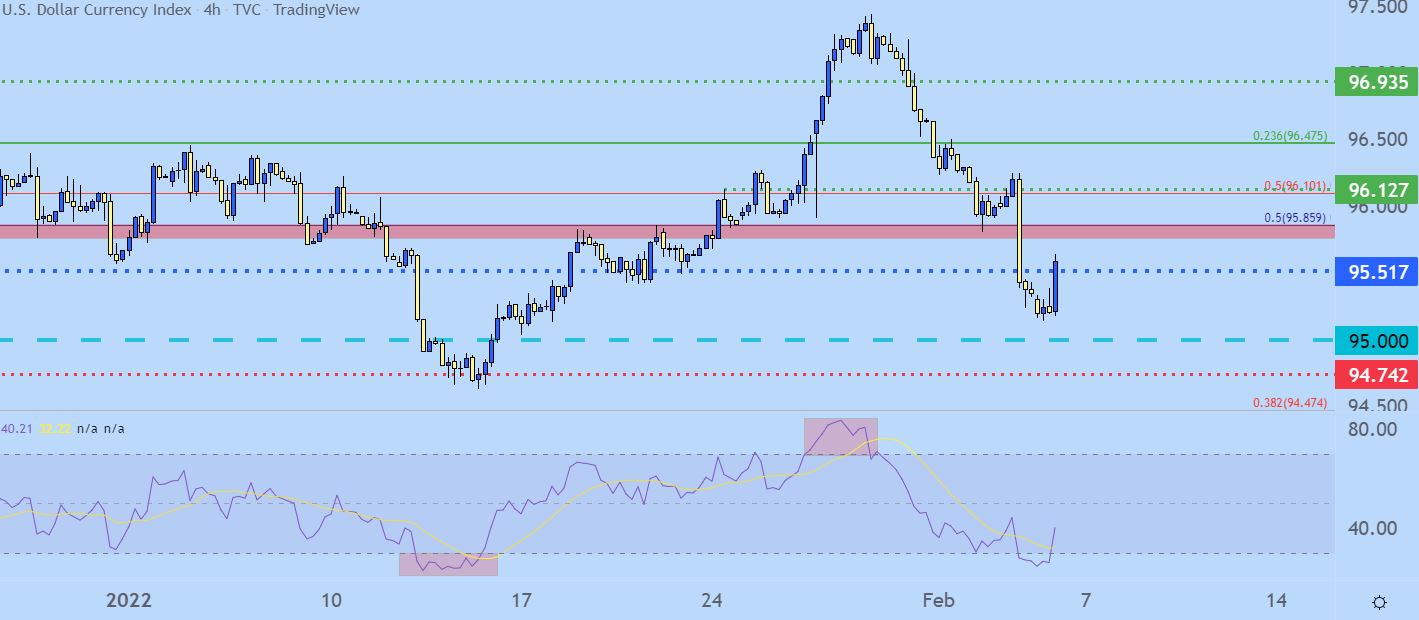
Chart prepared by James Stanley; USD, DXY on Tradingview
8:55
With the excitement starting to settle a bit for now, time to dig deeper into the numbers. The unemployment rate printed at an even 4% versus the expectation for 3.9%. Average hourly earnings came in at a whopping 5.7% against a 5.2% forecast.
This has been a very key focal point for the Fed. As they dismissed inflationary pressure throughout last year, calling it ‘transitory,’ the qualm was that inflation wasn’t yet showing in wages. This morning speaks to that and highlights the fact that inflation is hitting worker wages which, of course, will impact corporates that now have higher personnel costs.
This could be a plus for bond yields and a negative for stocks, all other factors held equal.
Sure enough, the 10 year Treasury Yield is at its highest level in over two years.
10-Year Treasury Yields
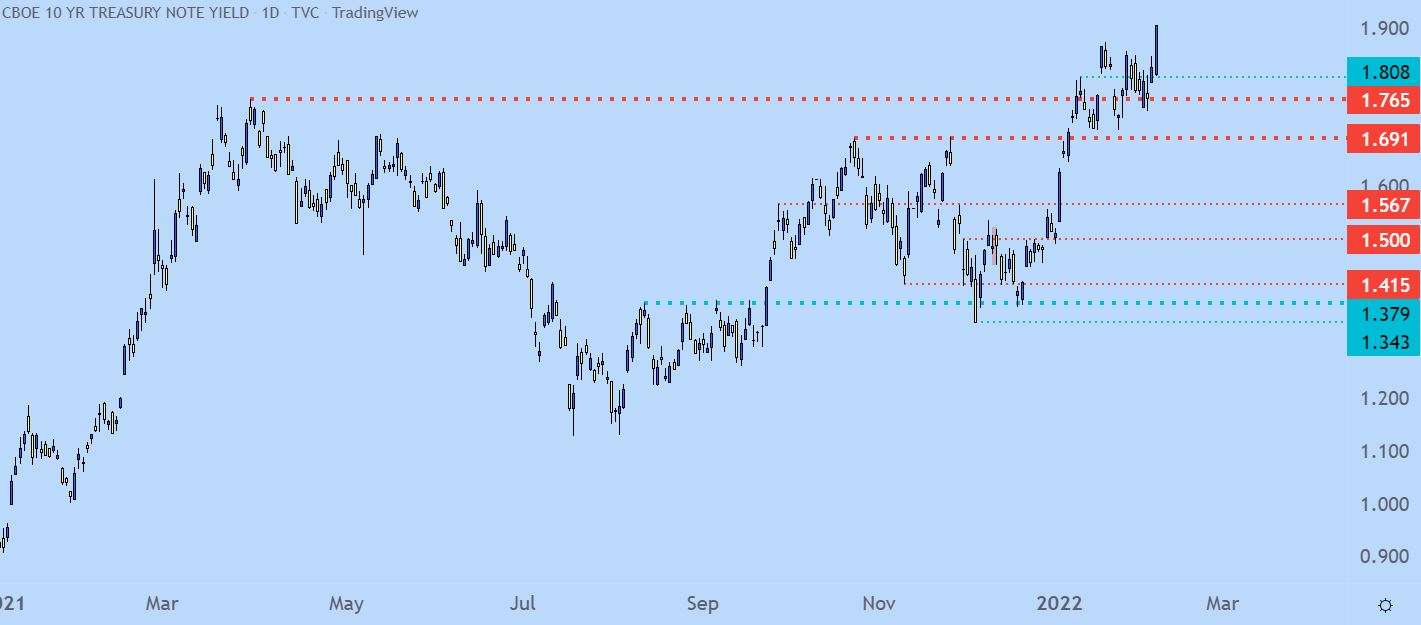
Chart prepared by James Stanley; TNX on Tradingview
8:50
EUR/USD is falling from the resistance that was set right at the monthly high. This was the same level that topped the advance a few weeks ago, at 1.1483. If this move holds there could be the build of a very attractive double-top formation.
EUR/USD Four-Hour Price Chart

Chart prepared by James Stanley; EURUSD on Tradingview
8:40
NFP just released and the headline number was a whopping +467k, proving once again that ADP employment numbers are a lousy predictor of Non-farm Payrolls.
The immediate move was a snap higher in the USD as the currency was fairly oversold ahead of the release. This goes hand-in-hand with the pullback in EUR/USD, which was at its most overbought since December of 2020.
US Dollar 15-Minute Price Chart

Chart prepared by James Stanley; USD, DXY on Tradingview
Stocks do not seem to be liking this print, as expectations for a week NFP and slower job growth or, perhaps even contractions in that data point could support a slower lift-off from the Fed. But, clearly that’s not what we have from this morning’s release and the bid is leaving equities, particularly the rate-sensitive Nasdaq 100, which is tipping down towards a key spot of support around 14,375 on the chart.
Nasdaq 100 Four-Hour Price Chart
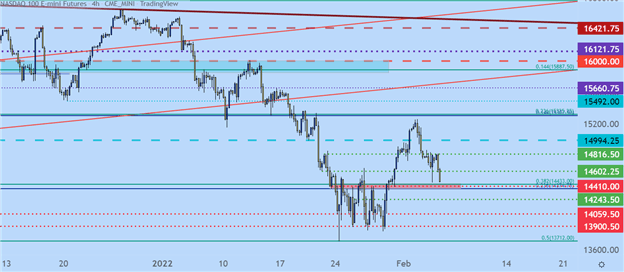
Chart prepared by James Stanley; Nasdaq 100 on Tradingview
8:20
Ahead of the event, the US Dollar is extremely weak, with the currency going into oversold territory on the four-hour chart. This has become a more recent occurrence in the USD as the currency went oversold a few weeks ago on the heels of a 7% CPI print, only to push into overbought territory a couple of weeks later after the FOMC rate decision.
In the week since that Fed meeting, matters have shifted quite a bit. Expectations have soured on US economic data and after yesterday’s ECB rate decision, hopes have started to build for an eventual shift in policy from the European Central Bank, with some research outlets even calling for hikes later this year. The US Dollar built in an evening star formation on Monday, which is often followed with the aim of bearish reversals – and that formation has continued to fill-in ever since with RSI now dipping into oversold territory.
US Dollar Four-Hour Price Chart

Chart prepared by James Stanley; USD, DXY on Tradingview
That’s amounted to a strong shift in the EUR/USD pair which is more than 57% of the DXY’s composition; so going along with that oversold reading in the USD is an overbought reading in EUR/USD.
In EUR/USD, levels remain a concern as prices are now pushing up towards the monthly high, with a hold ahead of the NFP release. That level is at 1.1484 and just above, at 1.1500 is a major psychological level that marks the top-end of a longer-term resistance zone.
Again mirroring the other side of the USD, EUR/USD had set up for this topside move earlier in the week, building in a morning star formation, often followed with the aim of bullish reversals. These levels are in-play ahead of this morning’s NFP release, and the prospect of reversals in both USD and EUR/USD could be themes of interest for this morning’s event.
EUR/USD Four-Hour Price Chart
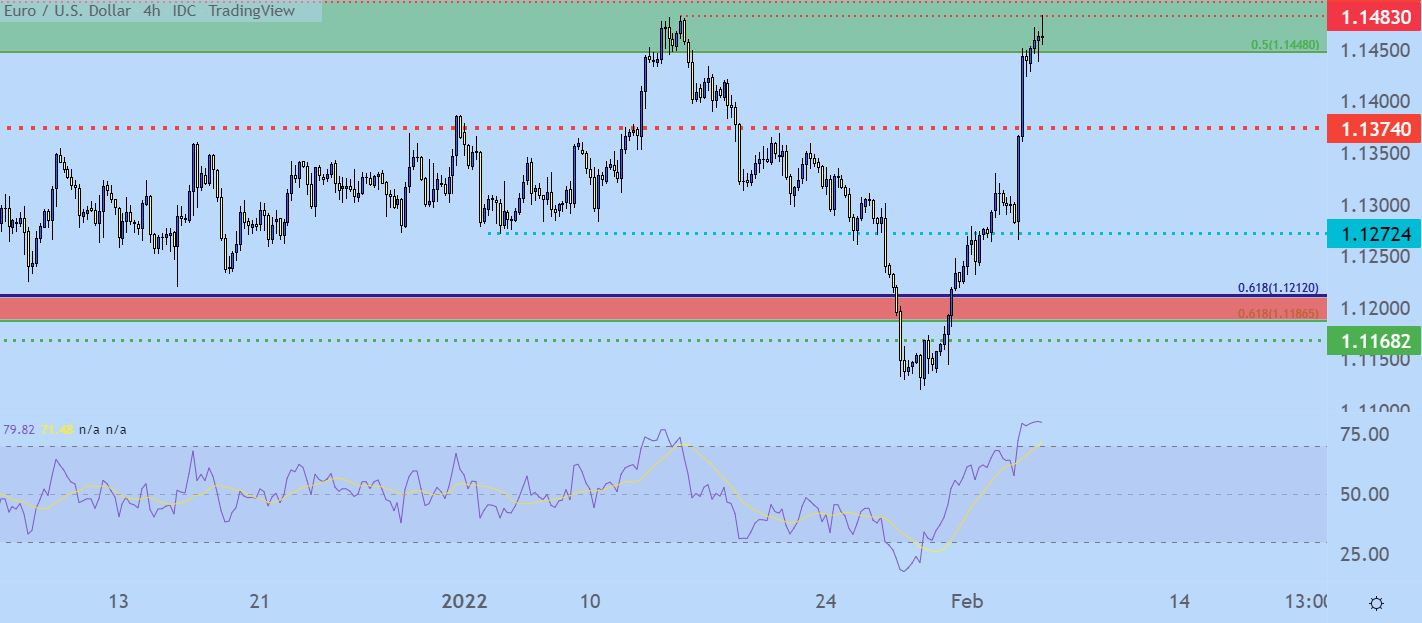
Chart prepared by James Stanley; EURUSD on Tradingview
--- Written by James Stanley, Senior Strategist for DailyFX.com
Contact and follow James on Twitter: @JStanleyFX


