


BTC, EUR/USD, USD/CAD Analysis and News
- False Break Through 40k Could Prompt Short-Term Bullish Rebound in Bitcoin
- EUR/USD Remains Within the Confines of its Two Month Range
- Upcoming Data Pivotal to January BoC Hike, USD/CAD Drops to Support
Following a soft week on Wall Street, Bitcoin as well as other cryptocurrencies have also come under pressure. A reminder that Bitcoin is a risk-on asset or in other words a liquidity haven, the pre-Covid view that Bitcoin was a safe-haven had been well and truly debunked when Bitcoin had cratered during the Q1 2020 sell-off. Thanks to the global central bank and government largess, the crypto space has been among the top performers of the “buy everything rally”. Therefore, with the Federal Reserve talking up balance sheet normalisation to come much sooner than many had expected, the potential near-term withdrawal of liquidity poses a threat to the crypto space and likely what we are seeing now, is cryptos discounting that future withdrawal of liquidity. The chart below provides a reminder as to how Bitcoin performed during QT in 2018. Admittedly, this is just a sample size of 1, not to mention it also came after a blow-off top at 20k. However, with institutional involvement much higher now than in 2018, macros matter more than ever before.
Bitcoin Performance During 2018
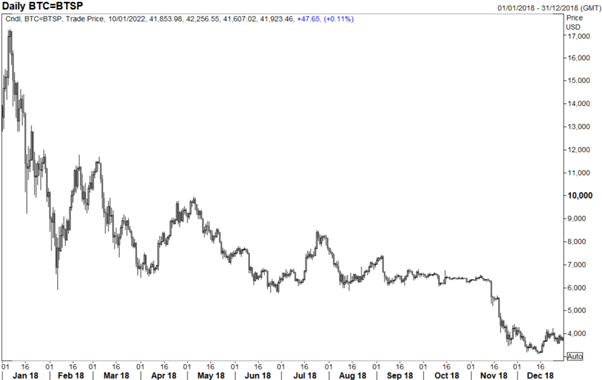
Source: Refinitiv
False Break Through 40k Could Prompt Short-Term Bullish Rebound
Taking a look at the chart, the major focus for Bitcoin is on the psychological 40k handle. While holding off for a break below over the weekend, having hit a low of 40.5k, with equities beginning to come under pressure, we can expect another test of 40k. That being said, for those who remain a Bitcoin bull, it would be preferable for a false break below 40k, much like what we have seen previously at psychological levels.
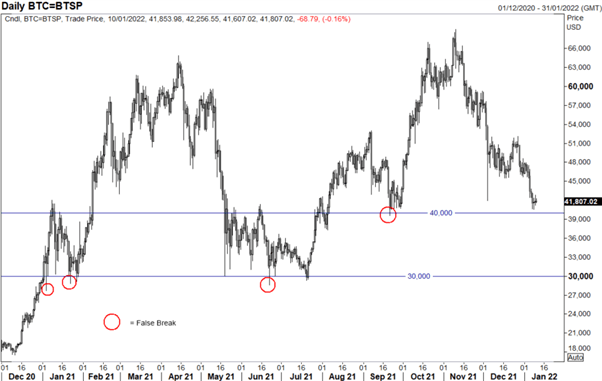
Source: Refinitiv
EUR/USD Remains Within the Confines of its Two Month Range
EUR/USD: The pair is on the back foot once again, partially retracing Friday’s surprise gains and thus sticking within the confines of its two-month range. The bias remains lower for EUR/USD, however, given the build of long positioning in the greenback, the move is very much a grind with momentum indicators signalling little signs of a range break anytime soon. Topside resistance resides at 1.1370-80 with support at 1.1270.
EUR/USD Chart: Daily Time Frame
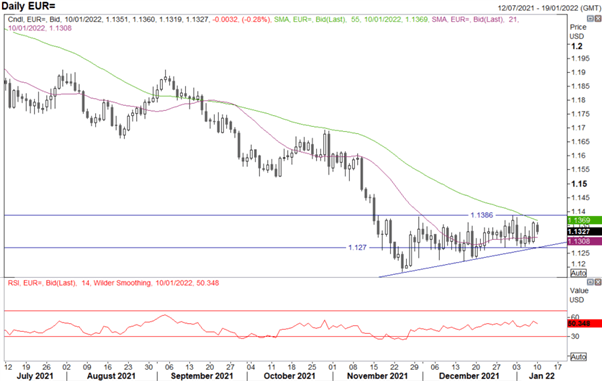
Source: Refinitiv
| Change in | Longs | Shorts | OI |
| Daily | -1% | -4% | -3% |
| Weekly | 4% | -10% | -5% |
Upcoming Data Pivotal to January BoC Hike
USD/CAD: Friday’s jobs report is a step in the right direction for those looking for a rate hike this month, however, there is still the upcoming BoC business outlook survey and inflation report which will be key to that discussion. In terms of the jobs report, the headline figure surprised on the upside and thus shows Canadian employment is now 240,500 above the level it was in February 2020. However, it is important to note that the figures do not cover the impact of Omicron, given that the reference week was December 5-11th. Therefore, with the surge in Omicron cases and subsequent lockdown happening since then, the numbers are slightly outdated. That said, USD/CAD is testing support at 1.2620-30, below which opens the doors to the BoC Dec meeting low at 1.2604. Little out this week from Canada, as such, the USD leg will be the key driver this week with US inflation and Chair Powell’s testimony in focus.
USD/CAD Chart: Daily Time Frame
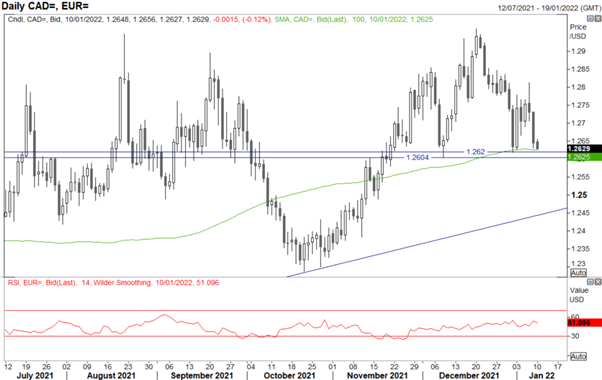
Source: Refinitiv
| Change in | Longs | Shorts | OI |
| Daily | -2% | 7% | 5% |
| Weekly | -30% | 38% | 13% |


