


Gold Talking Points:
- Gold Prices lose steam below key psychological resistance
- US Dollar strength weighs on precious metals
- Can equities hold gains into 2022?

Gold Prices Underpinned by Stronger US Dollar
Gold prices are currently testing a critical level of support and resistance after bulls surrendered a portion of their gains to a stronger USD.
Visit the DailyFX Educational Center to discover why news events are Key to Forex Fundamental Analysis
Despite a rise in both geopolitical tensions and inflationary pressures, stocks have recently climbed higher, enabling bulls trading equities to hold onto the upward trajectory that has persisted throughout the year.

Gold Technical Analysis
After peaking in August 2020, Gold prices have since declined, forming a wall of resistance above the key psychological level of $1,800.
Over the past three weeks, Gold bulls have managed to regain temporary control over the systemic, prominent trend in an effort to drive prices back towards the 38.2% Fibonacci retracement of the 2020 move, currently providing additional resistance at $1,835.
Gold Weekly Chart
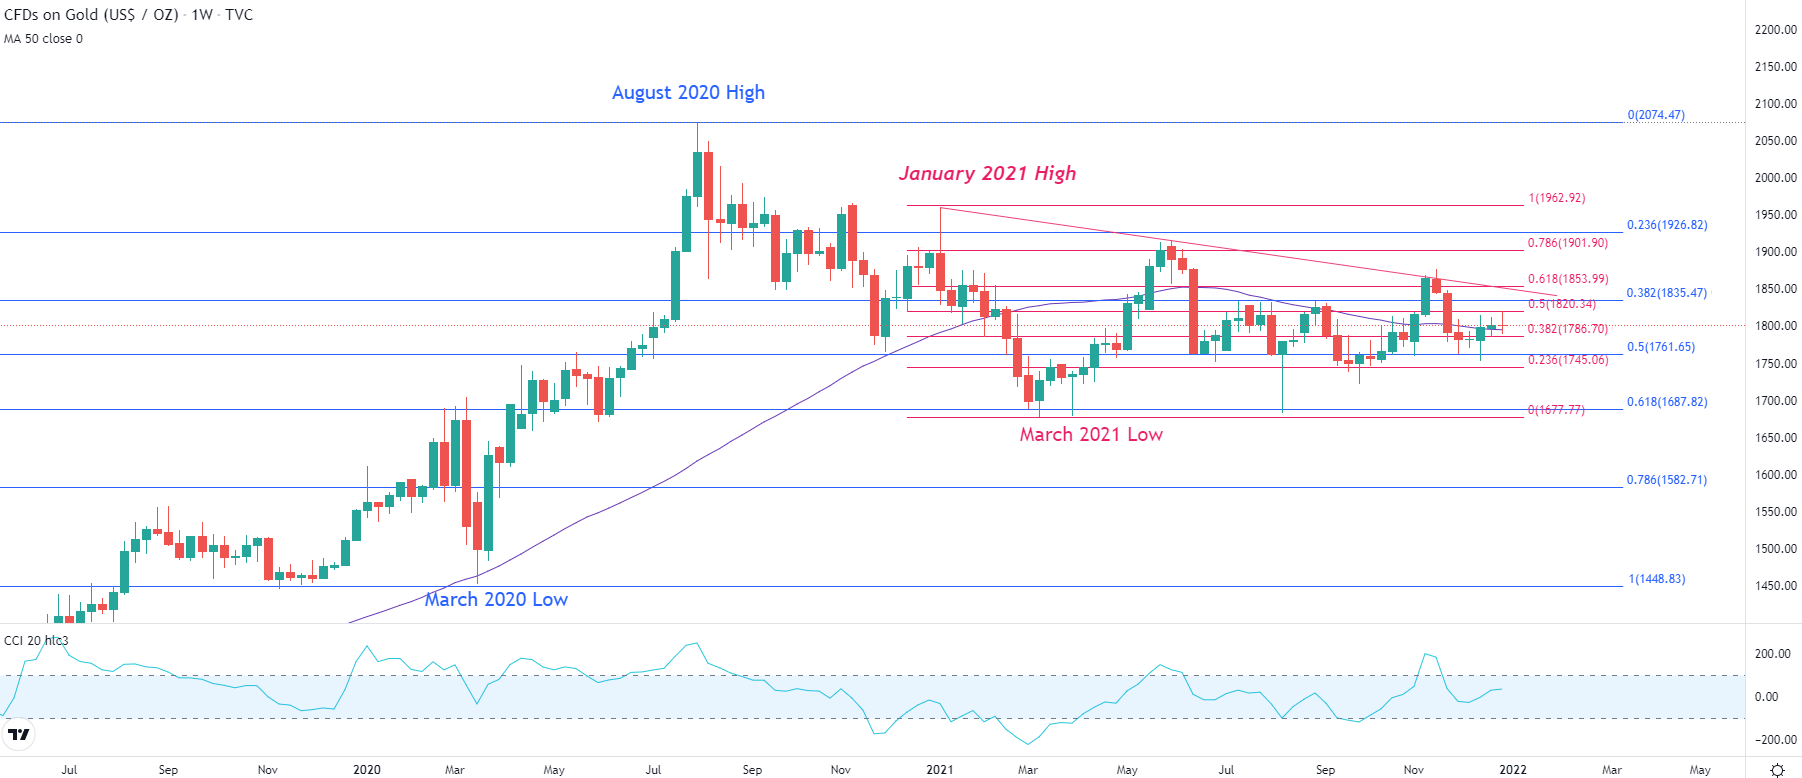
Chart prepared by Tammy Da Costa using TradingView
Meanwhile on the daily time-frame, price action remains encapsulated between the key Fibonacci levels of the 2021 move. This zone of confluency has continued to provide both support and resistance for the safe-haven metal between the levels of $1,786 and $1,820 respectively.
As prices trade sideways into the new year, the CCI (commodity channel index) continues to threaten oversold territory while the 50-day moving average (MA) provides additional support at the $1,800 handle.
Gold Daily Chart
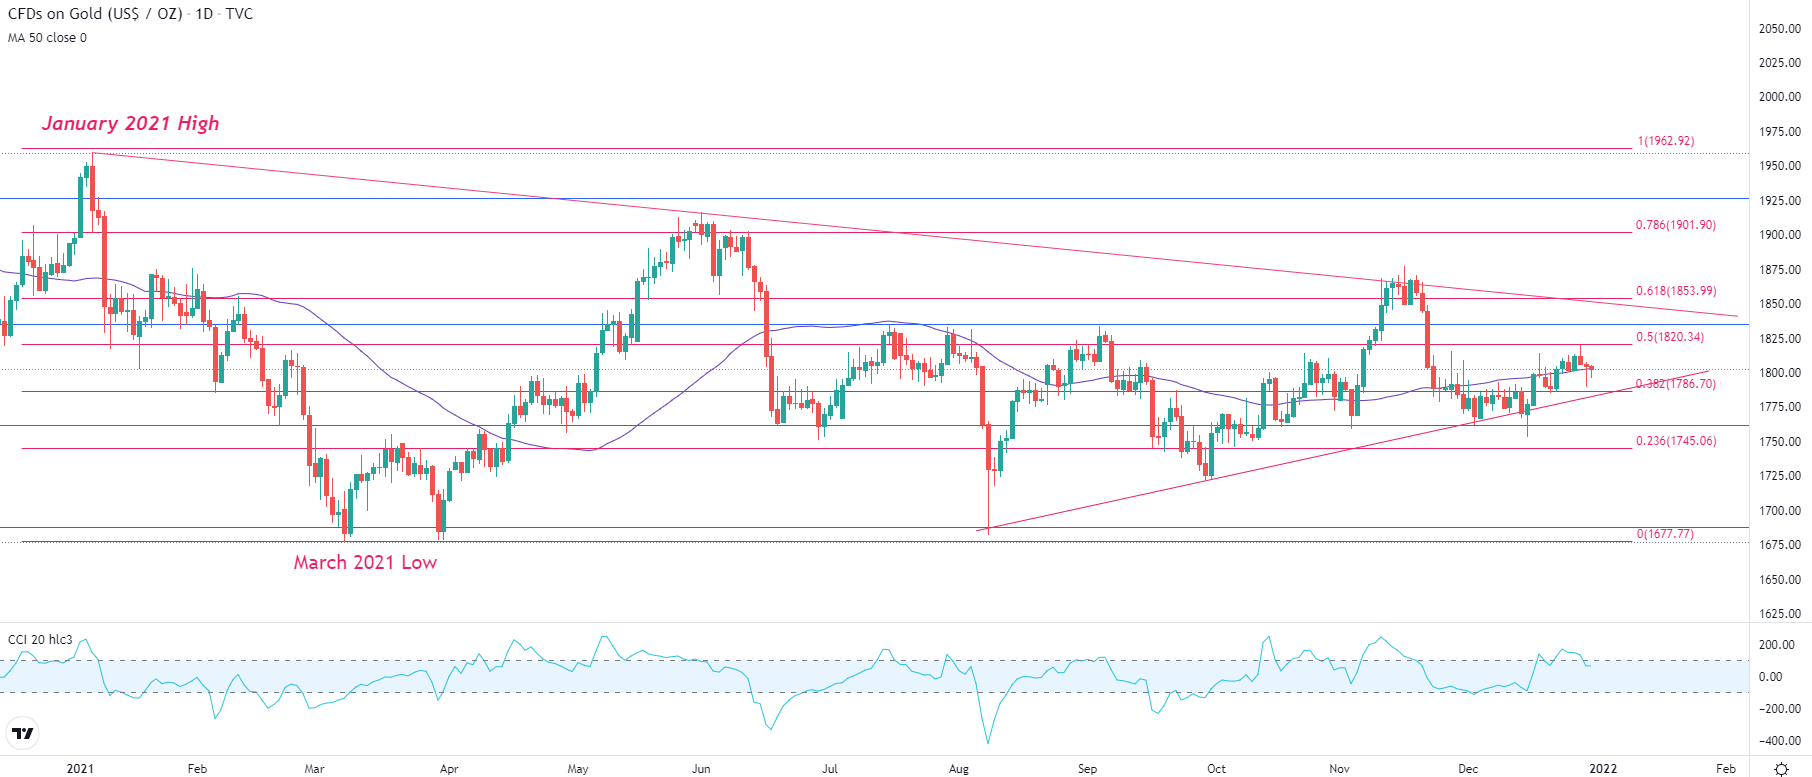
Chart prepared by Tammy Da Costa using TradingView
Gold Sentiment
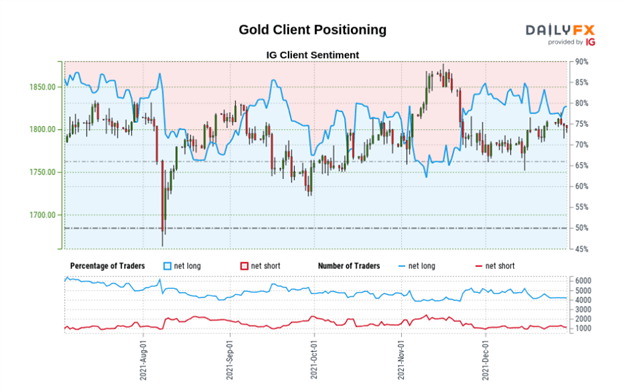
Gold: At the time of writing, retail trader data shows 79.19% of traders are net-long with the ratio of traders long to short at 3.81 to 1. The number of traders net-long is 2.17% higher than yesterday and 3.48% lower from last week, while the number of traders net-short is 2.28% lower than yesterday and 10.73% lower from last week.
We typically take a contrarian view to crowd sentiment, and the fact traders are net-long suggests Gold prices may continue to fall.
Traders are further net-long than yesterday and last week, and the combination of current sentiment and recent changes gives us a stronger Gold-bearish contrarian trading bias.
| Change in | Longs | Shorts | OI |
| Daily | 1% | -3% | -1% |
| Weekly | 2% | -8% | -2% |
--- Written by Tammy Da Costa, Analyst for DailyFX.com
Contact and follow Tammy on Twitter: @Tams707


