


GOLD ANALYSIS
- Gold bid as risk-off sentiment grows.
- $1800 turns support.
- IG client sentiment points to bearish bias.
BULLION FUNDAMENTAL BACKDROP
GOLD COCKTAIL: INFLATION, SAFE-HAVEN AND TIGHTENING
By now we have established that inflationary pressure (globally) is more sticky than initially forecasted by many central banks including the Federal Reserve. This plays into the hands of bullion which tends to outperform in an unrelenting inflation environment. With the festive period coming into its own, demand is unlikely to abate leaving some room for gold upside.
Earlier this week, spot gold fell on the back of a stronger dollar and higher U.S. 10-year Treasury yields (higher opportunity cost of holding gold). Sourcing from ‘hawkish’ Fed minutes and strong initial jobless claims jobs data, the dollar was unrelenting. Initially, other safe-haven currencies picked up momentum (JPY, CHF) as COVID-19 contagion concerns were being mulled over but Friday’s new variant fears sparked a more systemic effect. Gold’s safe-haven appeal is typically realized when risks are widespread as opposed to localized – in this case, unique to Europe until now.
SAFE-HAVEN ASSETS COMPARISON:
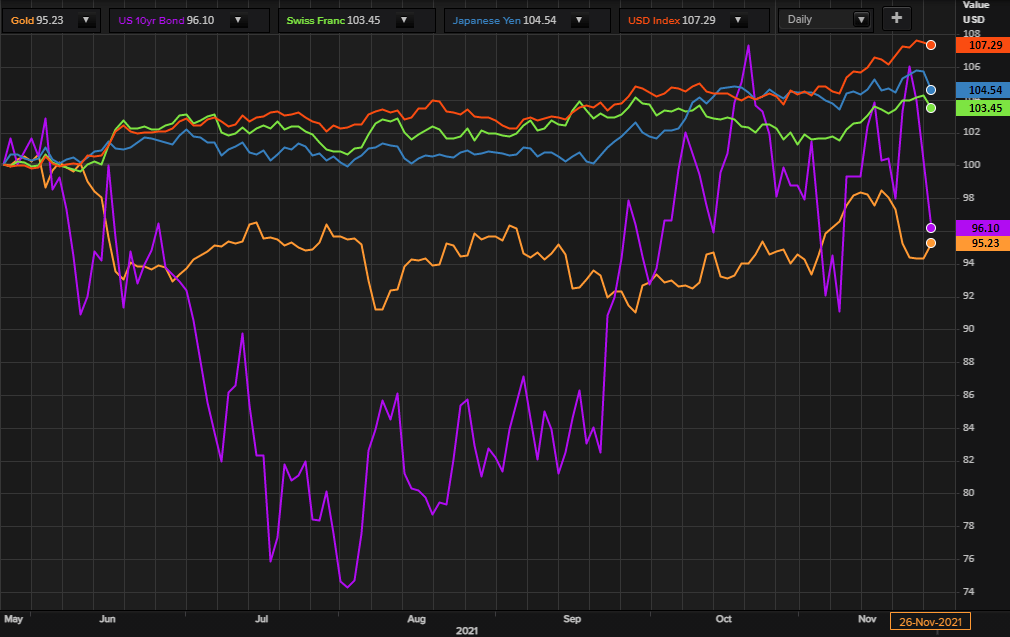
Source: Refinitiv
The Fed’s minutes this week revealed their openness to complete the tapering process sooner and begin rate hikes. Should this take place, gold could extend the current downward move but until tapering slows the backdrop remains supportive for the yellow metal – high inflation and low real yields. Interestingly, the CBOE Gold ETF Volatility Index (GVZ) which is historically positively correlated to spot gold has been ticking higher this week while gold has dipped (prior to the variant scare).
CBOE GOLD ETF VOLATILITY INDEX (GVZ):
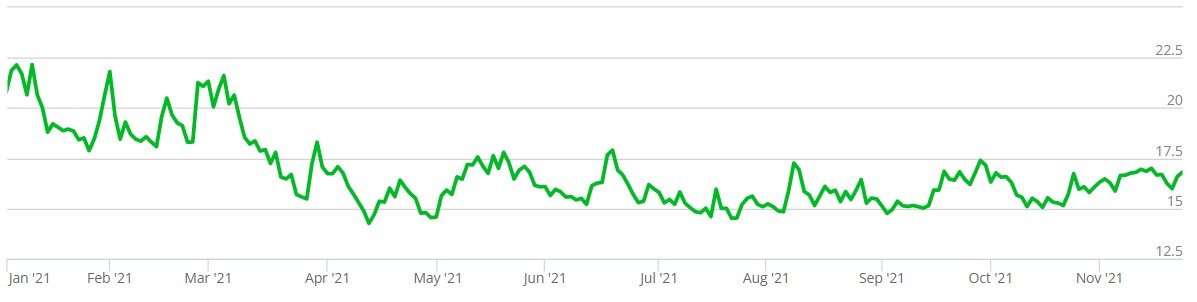
Source: CBOE
Gold flow data from the SPDR Gold Shares ETF has slowed this week (see chart below) exacerbating the downward pressure on gold. The U.S. Thanksgiving holiday has contributed to reduced trading volumes and will likely resume normal activity next week although today’s data could be noteworthy.
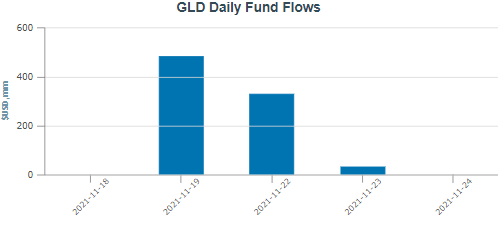
Source: ETF.com
GOLD ECONOMIC CALENDAR

Gold market movers next week come from high impact U.S. economic data (see calendar below) of which PMI and NFP data are significant. Positive PMI and better than expected NFP prints could intensify the current hawkish slant. This being said, a worsening virus circumstances could hold more influence over gold prices next week leaving more room for bulls.
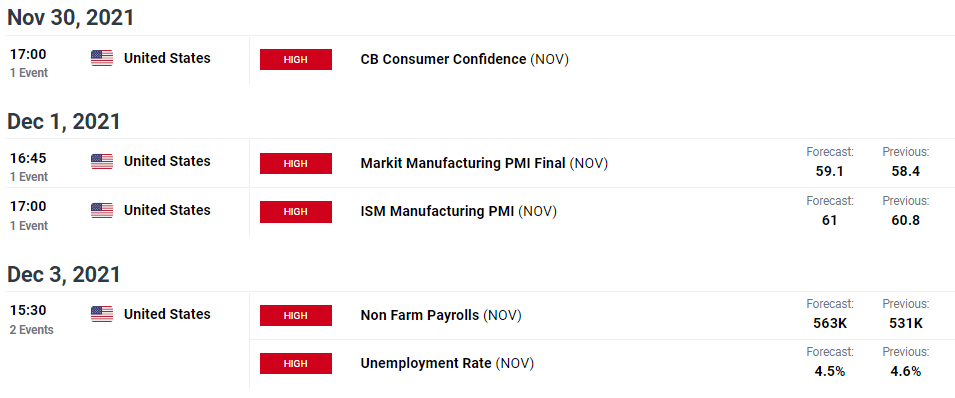
Source: DailyFX economic calendar
TECHNICAL ANALYSIS
GOLD PRICE WEEKLY CHART
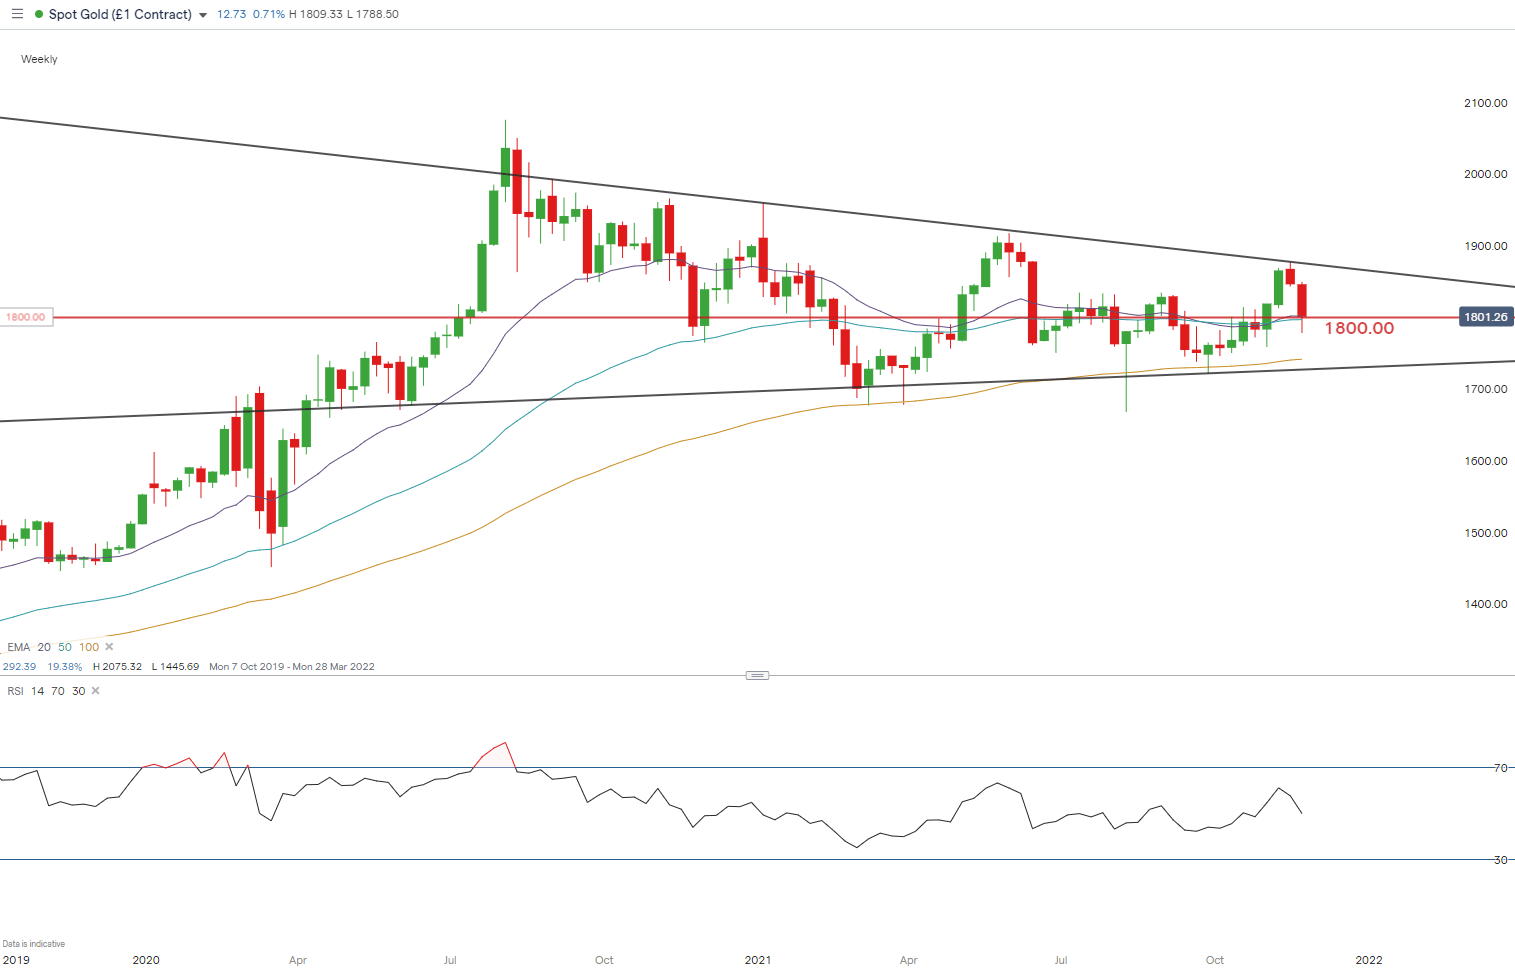
Chart prepared by Warren Venketas, IG
The long-term weekly chart above places gold trading within a symmetrical triangle (black) and while considered neutral in its bias, the pattern often favors the direction of the preceding trend (up). However, longer term investors will be looking for a weekly candle close above or below the respective triangle trendlines for a directional cue.
GOLD PRICE DAILY CHART
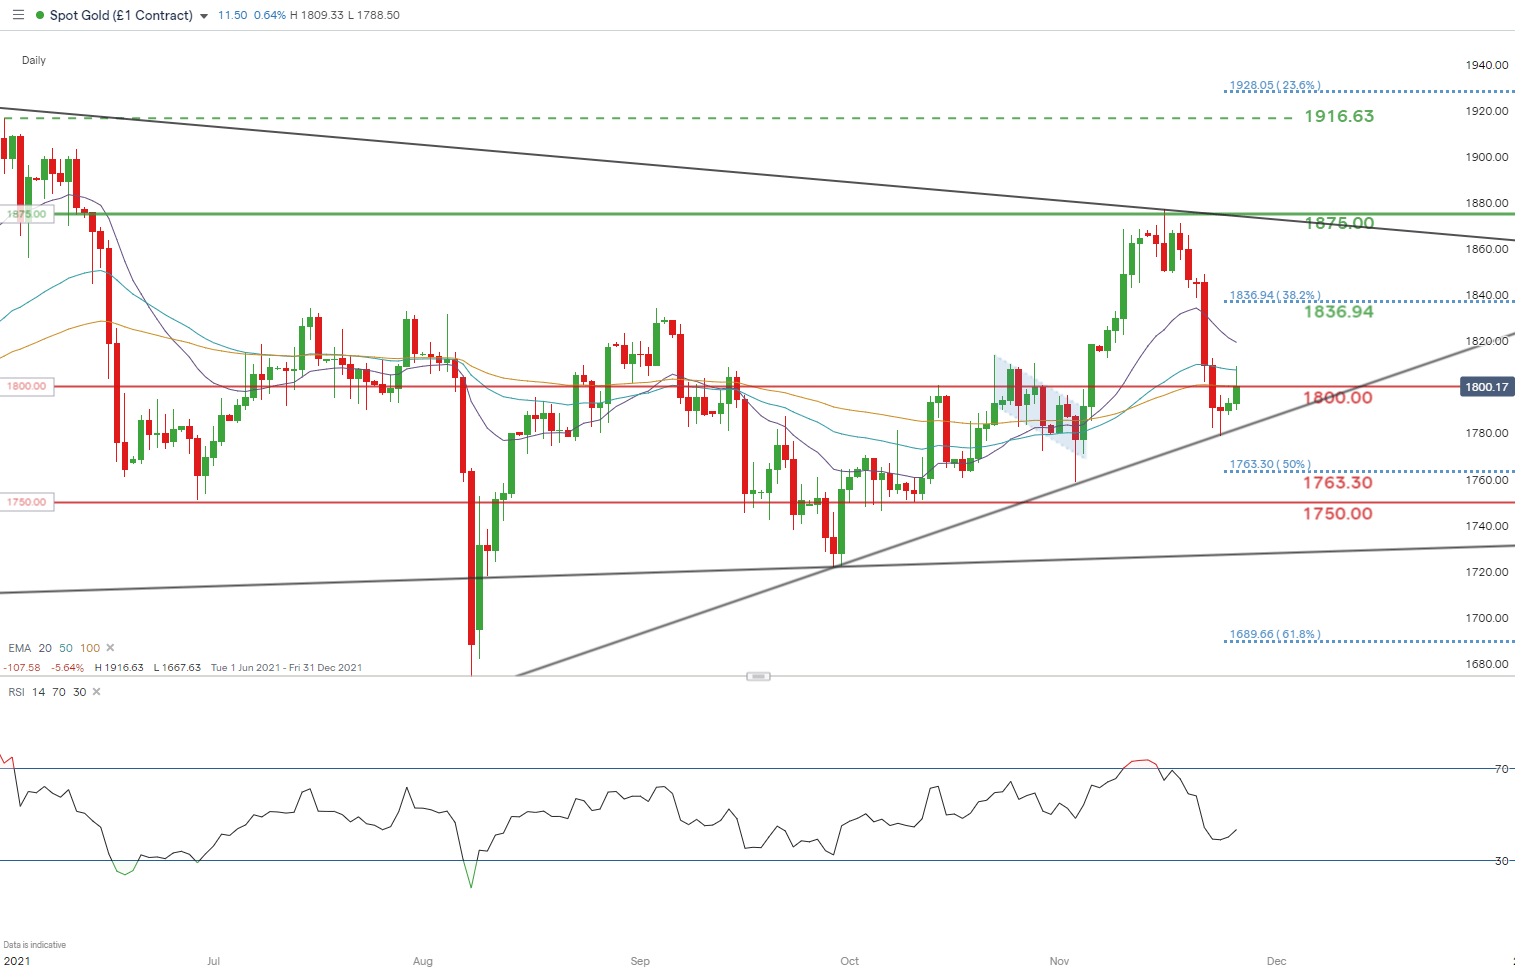
Chart prepared by Warren Venketas, IG
Dialing into the daily chart, price action reflects a clean push off triangle support (black) and a break above the $1800 psychological level (prior resistance). Should today’s candle close above this key level, subsequent resistance will come into consideration.

Resistance levels:
- 20-day EMA (purple)
- 50-day EMA (blue)
Support levels:
- 1800.00
- 1763.30 – 50% Fibonacci
- 1750.00
IG CLIENT SENTIMENT DATA SUGGESTS DOWNSIDE BIAS
IGCS shows retail traders are currently distinctly short on spotgold, with 81% of traders currently holding long positions (as of this writing). At DailyFX we typically take a contrarian view to crowd sentiment and the fact traders are net-long is suggestive of a short-term bearish inclination.
| Change in | Longs | Shorts | OI |
| Daily | 1% | -3% | -1% |
| Weekly | 2% | -8% | -2% |
Contact and follow Warren on Twitter: @WVenketas


