


Gold (XAU/USD) Talking Points
- Gold prices edge higher as the probability of a 2021 rate hike dissipates
- Taper tantrum-free Fed meeting places the employment report (NFP) at the forefront of risk-sentiment
- XAU/USD currently remains within the confines of key Fibonacci levels

In response to the Fed rate decision and the press conference that followed, Gold prices recovered a portion of this week’s losses as investors priced in a 2022 rate hike.
To Learn More About How to Trade Gold & Other Commodities, Visit DailyFX Education
Although inflation currently remains above the target of 2%, the Federal reserve has continued to reiterate their commitment to the labor market, placing the Non-farm payroll (NFP) report at the forefront of risk sentiment.
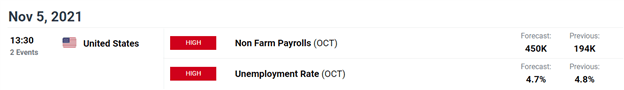
DailyFX Economic Calendar
For Gold, Silver and other safe-haven assets that have a negative correlation (move in opposite directions) to the US Dollar, slightly less hawkish commentary from Fed Chair Jerome Powell saw Gold and Silver edge higher as expectations of a 2021 rate hike dwindled.
However, higher yields may continue to support the US Dollar which will may hinder gold's ability to climb higher.

Gold Technical Levels
After rebounding off of the 61.8% Fibonacci retracement level of the 2020 move which continues to hold as long-term support at $1,680, Gold bulls temporarily managed to drive prices back above $1,900 before falling back towards the upper bound of the descending channel that has been forming since prices peaked in August last year.
With the formation of a doji candle now appearing on the weekly chart at the 38.2% retracement level of the 2021 move, the NFP report is expected to be the major risk event for the imminent move.
Gold (XAU/USD) Weekly Chart
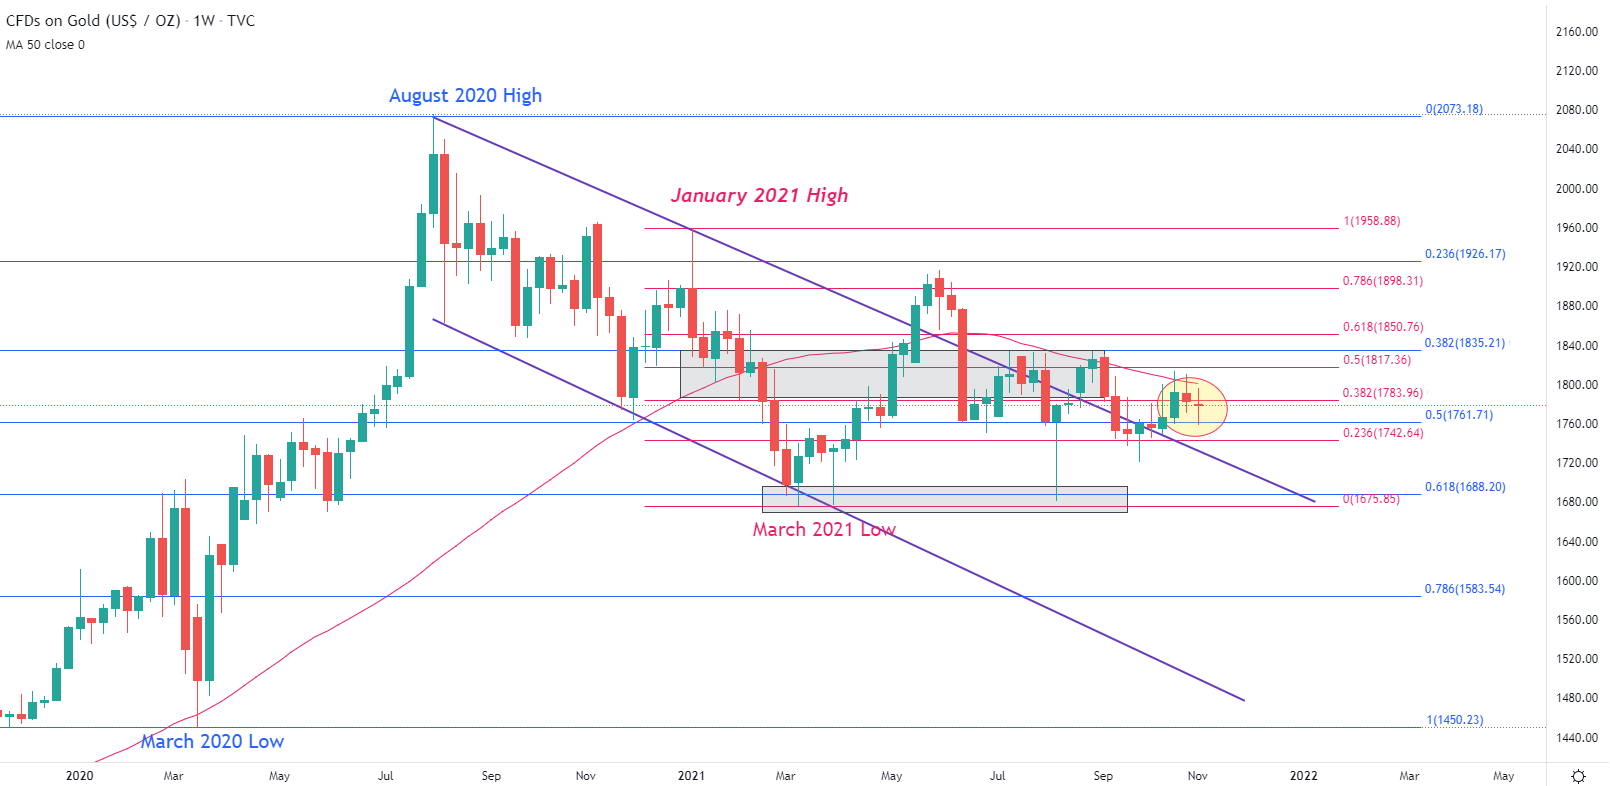
Chart prepared by Tammy Da Costa using TradingView
Meanwhile on the daily chart below, Gold prices are currently testing trendline resistance which coincides with the 50-day moving average (MA).
At the time of writing, additional resistance currently remains at the key psychological of $1,785 with support holding firm at the 50% retracement of the 2020 move at around $1,762.
Gold (XAU/USD) Daily Chart
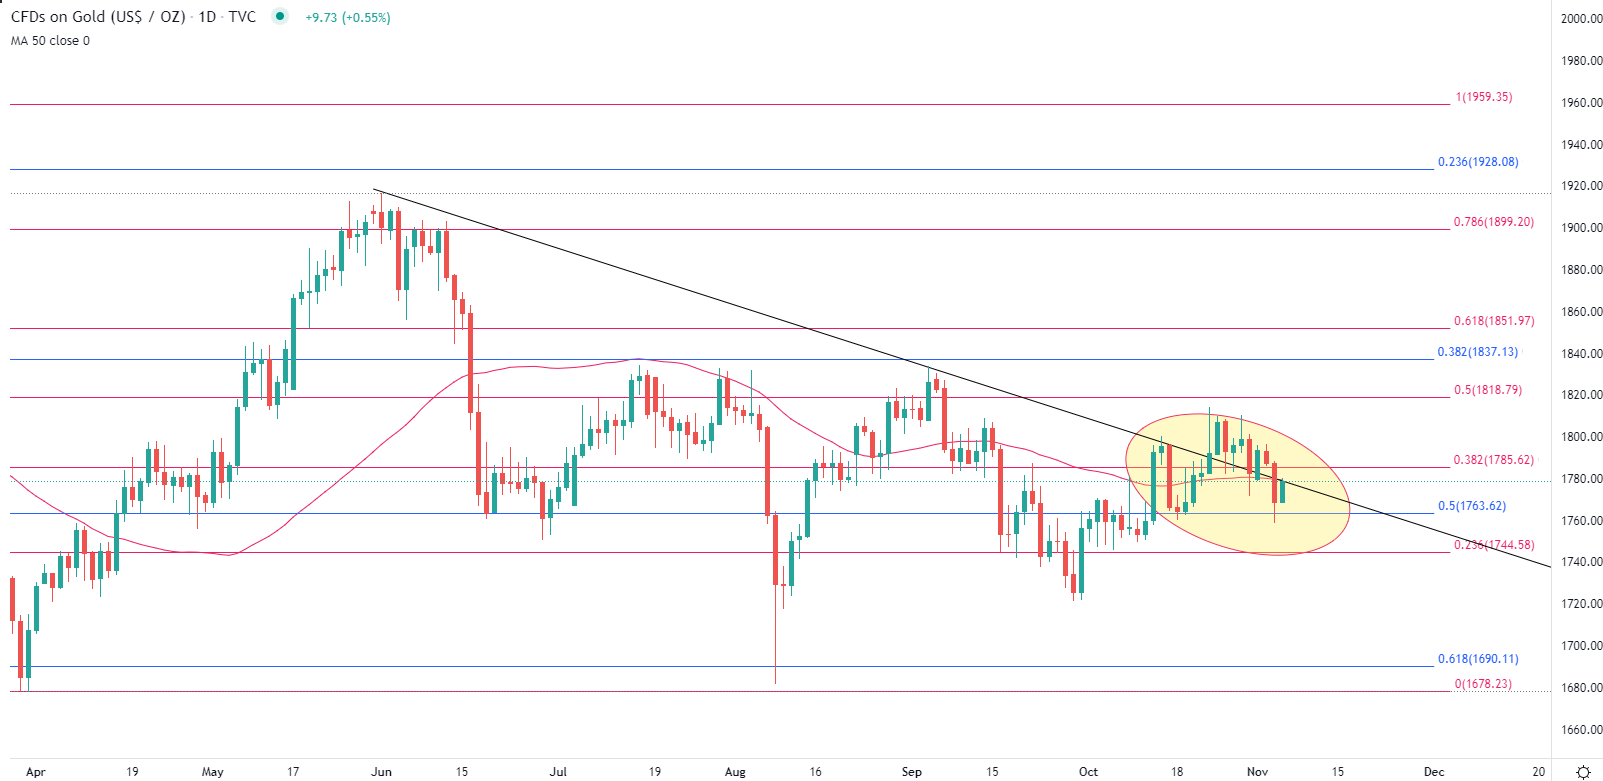
Chart prepared by Tammy Da Costa using TradingView
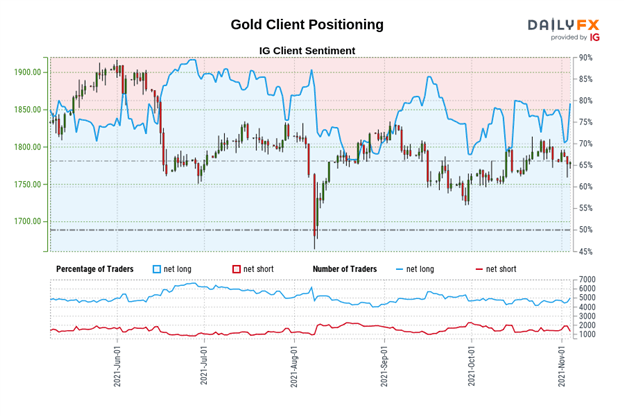
Gold Sentiment
| Change in | Longs | Shorts | OI |
| Daily | 1% | -3% | -1% |
| Weekly | 2% | -8% | -2% |
Gold: Retail trader data shows 75.73% of traders are net-long with the ratio of traders long to short at 3.12 to 1. The number of traders net-long is 3.05% higher than yesterday and 5.11% higher from last week, while the number of traders net-short is 11.97% lower than yesterday and 4.77% higher from last week.
We typically take a contrarian view to crowd sentiment, and the fact traders are net-long suggests Gold prices may continue to fall.
Traders are further net-long than yesterday and last week, and the combination of current sentiment and recent changes gives us a stronger Gold-bearish contrarian trading bias.
--- Written by Tammy Da Costa, Analyst for DailyFX.com
Contact and follow Tammy on Twitter: @Tams707


