


XAU/USD ANALYSIS
- Details around Fed announcement to give markets directional bias.
- All eyes on $1800 key level.
- IG client sentiment suggests near term uncertainty.
GOLD FUNDAMENTAL BACKDROP
The Fed policy statement scheduled later today seems to be weighing negatively on spot gold prices as the expectancy around tapering and rate hike guidance are skewed towards a strengthening U.S. dollar. Gold’s appeal as an inflation hedge has thus far disappointed but the challenge for gold bulls comes from a hawkish Fed which should lead to higher U.S. Treasury yields – increasing the cost to hold gold.
What to look out for from the Fed?
- QE tapering by $15 billion per month – expected.
- Talk about tightening which could see USD strengthen and gold fall.
- Dovish slant whereby Fed remains firm on the transitory inflationary stance and will await further data before tightening is considered – bullish for gold.
GOLD ECONOMIC CALENDAR

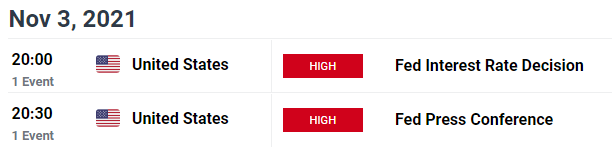
Source: DailyFX economic calendar
TECHNICAL ANALYSIS
GOLD PRICE DAILY CHART
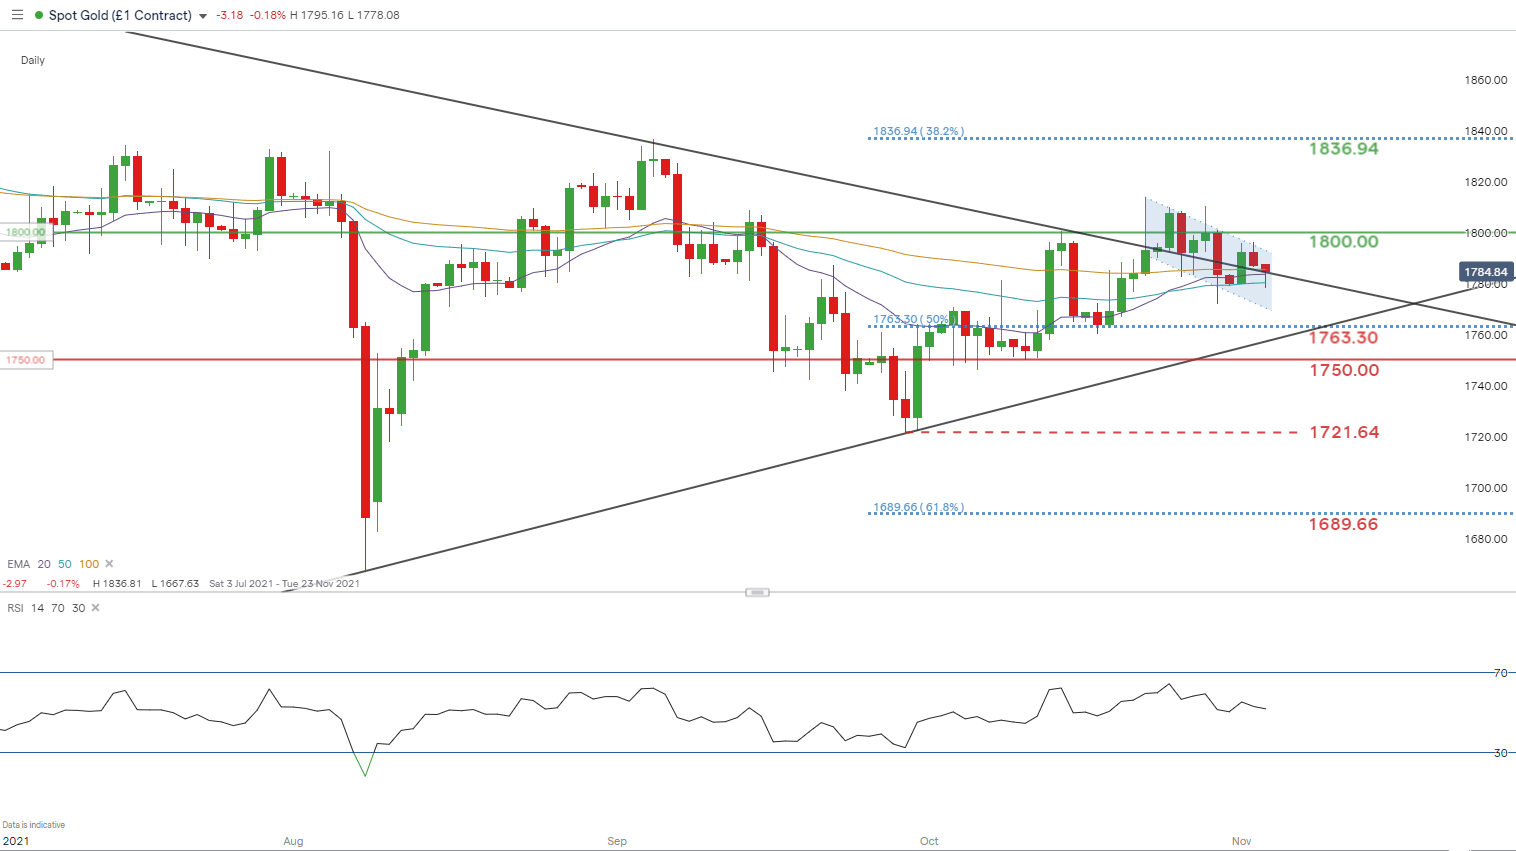
Chart prepared by Warren Venketas, IG
The daily gold chart above highlights the recent breakout from the symmetrical triangle (black) however, failure to reach the expected heights usually associated with such a significant break has aligned with fundamental uncertainty and the $1800.00 psychological level. A confirmation close above this area of confluence will likely spark a move towards the 38.2% Fibonacci resistance level at $1836.94 – Fibonacci taken from March 2020 low to August 2020 high. This confirmation close will most probably result from a hawkish Fed announcement. The bull flag pattern (blue) may unfold should the hawkish rhetoric shine through.
From the bearish perspective, a more patient angle from the Fed could bring the subsequent support targets into consideration.

Resistance levels:
- 1836.94
- 1800.00
Support levels:
- 1763.30
- 1689.66
IG CLIENT SENTIMENT DATA MIXED
IGCS shows retail traders are currently distinctly short on spotgold, with 73% of traders currently holding long positions (as of this writing). At DailyFX we typically take a contrarian view to crowd sentiment and the fact traders are net-long is suggestive of a bearish inclination however, recent activity shows a greater net change in shorts which results in a mixed disposition.
| Change in | Longs | Shorts | OI |
| Daily | 1% | -3% | -1% |
| Weekly | 2% | -8% | -2% |
--- Written by Warren Venketas for DailyFX.com
Contact and follow Warren on Twitter: @WVenketas


