


Nasdaq 100, Hang Seng, Treasuries, US CPI, Technical Analysis – Asia Pacific Indices Briefing
- Nasdaq 100, S&P 500, Dow Jones underperform in the wake of non-farm payrolls data
- Labor supply issues underscored inflationary pressures, commodity prices rose on Monday
- Hang Seng Index vulnerable as markets await Wednesday’s US CPI print, Treasury yields rise

Monday’s Wall Street Trading Session Recap
Equities on Wall Street ended Monday broadly lower, with near-even losses seen between the 3 major benchmark stock indices. The Nasdaq 100, Dow Jones and S&P 500 (futures) closed -0.72%, -0.69% and -0.71% respectively. It was a fairly quiet session with few economic event risk. The U.S. Columbus Day holiday left bond markets closed, though stock markets were trading.
The deterioration in sentiment could have been a continuation of the market reaction to last week’s non-farm payrolls report. A miss in the headline jobs gain was accompanied by signs of labor supply issues. While fewer jobs were added, and the labor force participation rate declined, those that did find new positions received higher earnings.
That is likely continuing to test and strain the Federal Reserve’s position on the transitory inflation narrative. This is as commodity prices climbed on Monday. These included crude oil, aluminum and iron ore. Rising Treasury yield futures could be indicating that the markets anticipate an increasingly less-dovish Fed as it prepares to initiate tapering, likely as early as November.
Nasdaq Technical Analysis
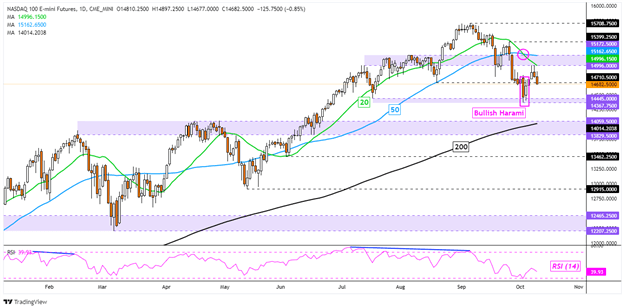
The Nasdaq 100 is seeing mixed technical signals. Last week, a Bullish Harami candlestick pattern was confirmed, hinting at near-term gains. At the same time, there was a bearish crossover between the 20- and 50-day Simple Moving Averages (SMA). Prices are now trading in-between these two signals. Still, the long-term 200-day SMA sits around the 13829 – 14059 inflection zone. In the event of further losses, this could reinstate the dominant upside focus.
Introduction to Technical Analysis
Candlestick Patterns
Recommended by Daniel Dubrovsky
Nasdaq 100 – Daily Chart
Tuesday’s Asia Pacific Trading Session
The sour tone set on Wall Street risks reverberating outwards as Tuesday’s Asia-Pacific trading session gets underway. Australia will release business conditions and confidence data. Recent gains in coal and iron ore prices could keep the ASX 200 lifted. These commodities are key exports. Meanwhile, the Kospi Index will be eyeing the Bank of Korea monetary policy announcement. The 7-day repurchase rate is expected to be left unchanged at 0.75%.
A relatively quiet economic docket may keep traders focused on the overall market mood. This risks sending regional indices, such as the Nikkei 225 and Hang Seng, lower. All eyes are on the US CPI report, which is due on Wednesday. Another elevated reading could further push Treasury yields higher. This may continue denting sentiment as prospects of higher rates slowly reduces the appeal of riskier assets.
Trading Strategies and Risk Management
Global Macro
Recommended by Daniel Dubrovsky
Hang Seng Technical Analysis
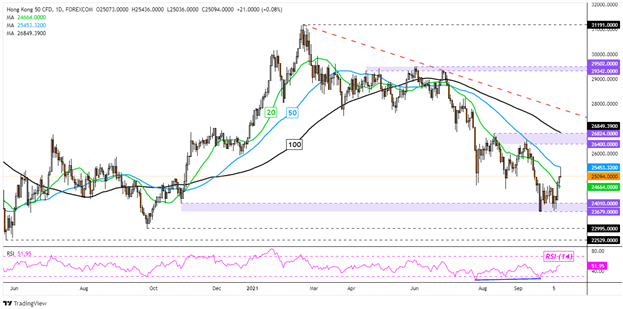
The Hang Seng Index left behind a fairly large upper shadow on Monday as prices touched the 50-day SMA. Still, that leaves the index above the 20-day line. Moreover, recent positive RSI divergence showed that downside momentum was fading as the index tested the 23679 – 24010 support zone. Resuming losses entails taking out that range. Rising above the 50-day SMA could be a near-term bullish signal on the other hand, placing the focus on the 26400 – 26824 resistance zone.
Hang Seng – Daily Chart
--- Written by Daniel Dubrovsky, Strategist for DailyFX.com
To contact Daniel, use the comments section below or @ddubrovskyFX on Twitter
Trade Smarter - Sign up for the DailyFX Newsletter
Receive timely and compelling market commentary from the DailyFX team


