


Gold (XAU/USD) Price, Chart, and Analysis
- Gold stuck below prior support as the FOMC meeting looms.
- Any rally higher is expected to be limited.
Trade Smarter - Sign up for the DailyFX Newsletter
Receive timely and compelling market commentary from the DailyFX team
Wednesday’s FOMC meeting is keeping the gold market in check as traders look to Fed chair Jerome Powell to give them some more clarity over when the central bank will pare back its USD120 billion a month bond-buying program. The US dollar has picked up a bid in the past weeks on expectations that chair Powell may at least give some tapering hints but with this looking fully priced-in, any hawkish disappointment may see the USD sell-off, boosting the price of gold. Any move higher however will likely be short-lived as tapering is a matter of when and not if and the greenback will move higher over the next few months.
Keep up to date with all market-moving data releases and events by using the DailyFX Calendar
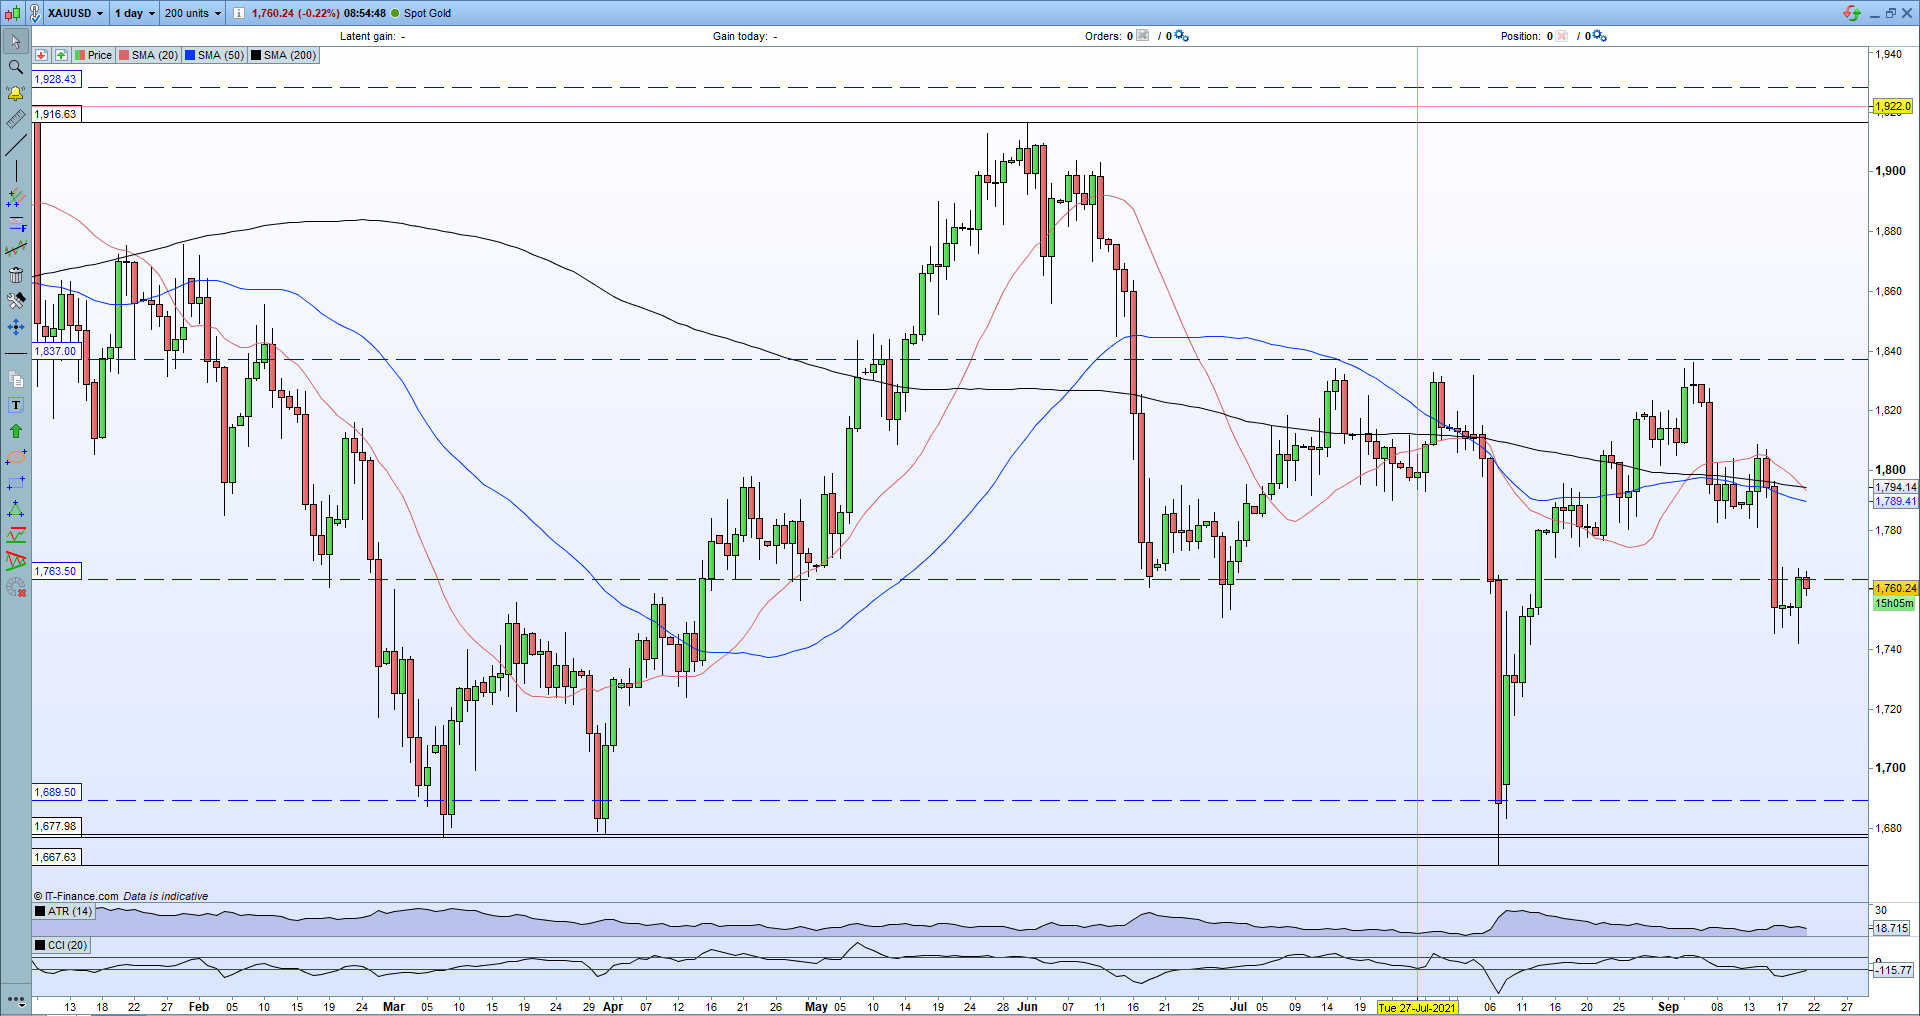
The daily gold chart shows the precious metal back at an important level, based off the 50% Fibonacci retracement level of the March 2020/August 2020 move. This level continues to attract price action and now acts as resistance back into the $1,763/oz. - $1,837/oz. trading range that has held sway since mid-June, ex the early-August flash crash. A break and close above support will allow gold to drift higher although there are a cluster of old lows and highs and all three simple moving averages all the way back to $1,800/oz. It is likely that any rally will be short-lived.

Gold (XAU/USD) Daily Price Chart September 21, 2021
Retail trader data show80.44% of traders are net-long with the ratio of traders long to short at 4.11 to 1. The number of traders net-long is 3.02% lower than yesterday and 10.69% higher from last week, while the number of traders net-short is 9.75% higher than yesterday and 0.47% higher from last week.
We typically take a contrarian view to crowd sentiment, and the fact traders are net-long suggests Gold prices may continue to fall.Positioning is less net-long than yesterday but more net-long from last week. The combination of current sentiment and recent changes gives us a further mixed Gold trading bias.

What is your view on Gold – bullish or bearish?? You can let us know via the form at the end of this piece or you can contact the author via Twitter @nickcawley1.


