


Japanese Yen Key Takeaways
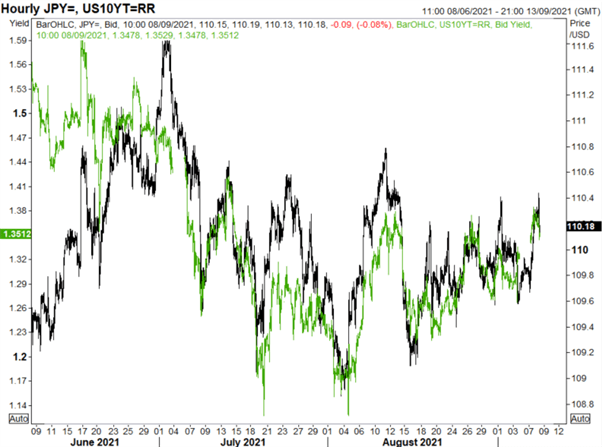
Risk sentiment remains on the softer side and has subsequently spilt into FX markets. In turn, this has naturally supported the safe-havens, at the expense of higher beta currencies. Although, while yesterdays moves in FX had largely been driven by the USD, today sees the Japanese Yen also gaining ground with USD/JPY heading back down to the 110.00 handle as the pair tracks US yields lower. I have said previously that the USD/JPY tracks the US 10yr yield very closely and thus when trading USD/JPY it is important to watch treasury yields, as the chart below demonstrates.
USD/JPY vs US 10Y Yield
Looking at the chart, price action in the pair remains somewhat choppy having maintained a 109.50-110.50 range. Momentum is also negative for the Japanese Yen, however, some way from being considered stretched, which does pose upside risks for USD/JPY should US yields turnback higher. The pair has made a slight break above the descending trendline from the YTD peak, although a firm close above will be the main focus for bulls. On the topside, resistance sits at 110.60-70, while support resides at 109.75 and 109.50.
USD/JPY Chart: Daily Time Frame
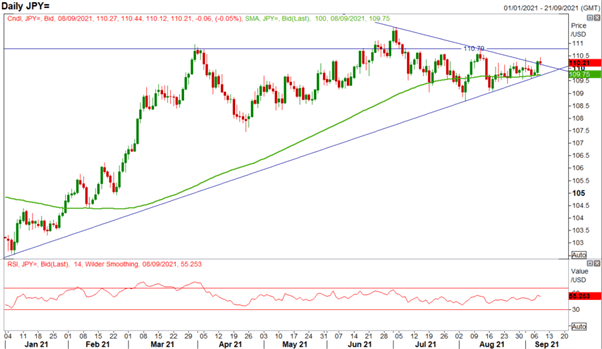
Source: Refinitiv
For now, price action is coiling up and readying for a breakout, the difficulty of course is identifying which way that will be. Therefore, I will be keeping a watchful eye on the US 10yr and where a firm break above 1.38% could see USD/JPY catapult higher, also the moves in the Nikkei 225, which has seen a strong bid since PM Suga announced he will not run in the LDP Leadership Election.
US 10yr Yield Chart: Daily Time Frame
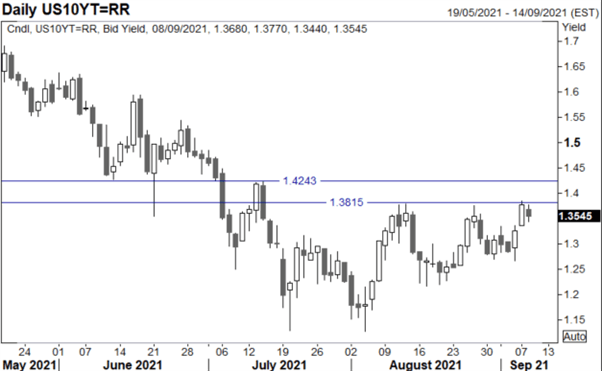
Source: Refinitiv
A Guide to Support and Resistance Trading
| Change in | Longs | Shorts | OI |
| Daily | -2% | 2% | 0% |
| Weekly | 12% | -16% | -6% |
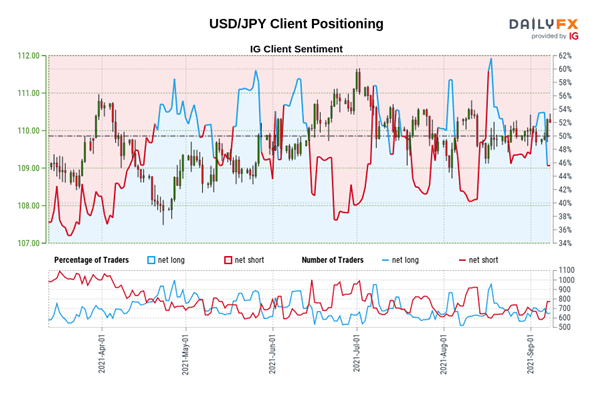
IG Client Sentiment Gives Stronger Bullish Contrarian Bias
Data shows 44.51% of traders are net-long with the ratio of traders short to long at 1.25 to 1. The number of traders net-long is 9.60% lower than yesterday and 0.63% higher from last week, while the number of traders net-short is 13.19% higher than yesterday and 7.11% higher from last week.
We typically take a contrarian view to crowd sentiment, and the fact traders are net-short suggests USD/JPY prices may continue to rise.
Traders are further net-short than yesterday and last week, and the combination of current sentiment and recent changes gives us a stronger USD/JPY-bullish contrarian trading bias.
Trade Smarter - Sign up for the DailyFX Newsletter
Receive timely and compelling market commentary from the DailyFX team
https://www.dailyfx.com/education/learn-technical-analysis/support-and-resistance-trading.html


