


Australian Dollar, AUD/CAD, AUD/JPY, AUD/CHF, AUD/NZD – Talking Points
- AUD/CAD breaking higher out of downward channel, 0.9360 next target
- AUD/JPY entering key supply area around 81.50, trendline resistance ahead
- AUD/CHF reversal continues, entering key pivot area around 0.6800
- AUD/NZD continues to break lower on follow through from head & shoulders pattern

AUD/CAD Technical Analysis
The Australian Dollar has seen numerous trend reversals on the back of a strong GDP print for Q2. Since late February, AUD/CAD had been confined to a downward parallel channel, simply pinging between the goalposts while bearish momentum reigned supreme. The pair’s recent reversal has seen a clean break from this 6-month channel, while also trading back above the 50-day moving average. Topside resistance may come around 0.9360, a key pivot level through the consolidation period seen in the early summer months. With room to run until the cross reaches overbought territory on the daily RSI, the current rally may have additional legs. Near-term support on a retracement may be around 0.92484.
AUD/CAD Daily Chart
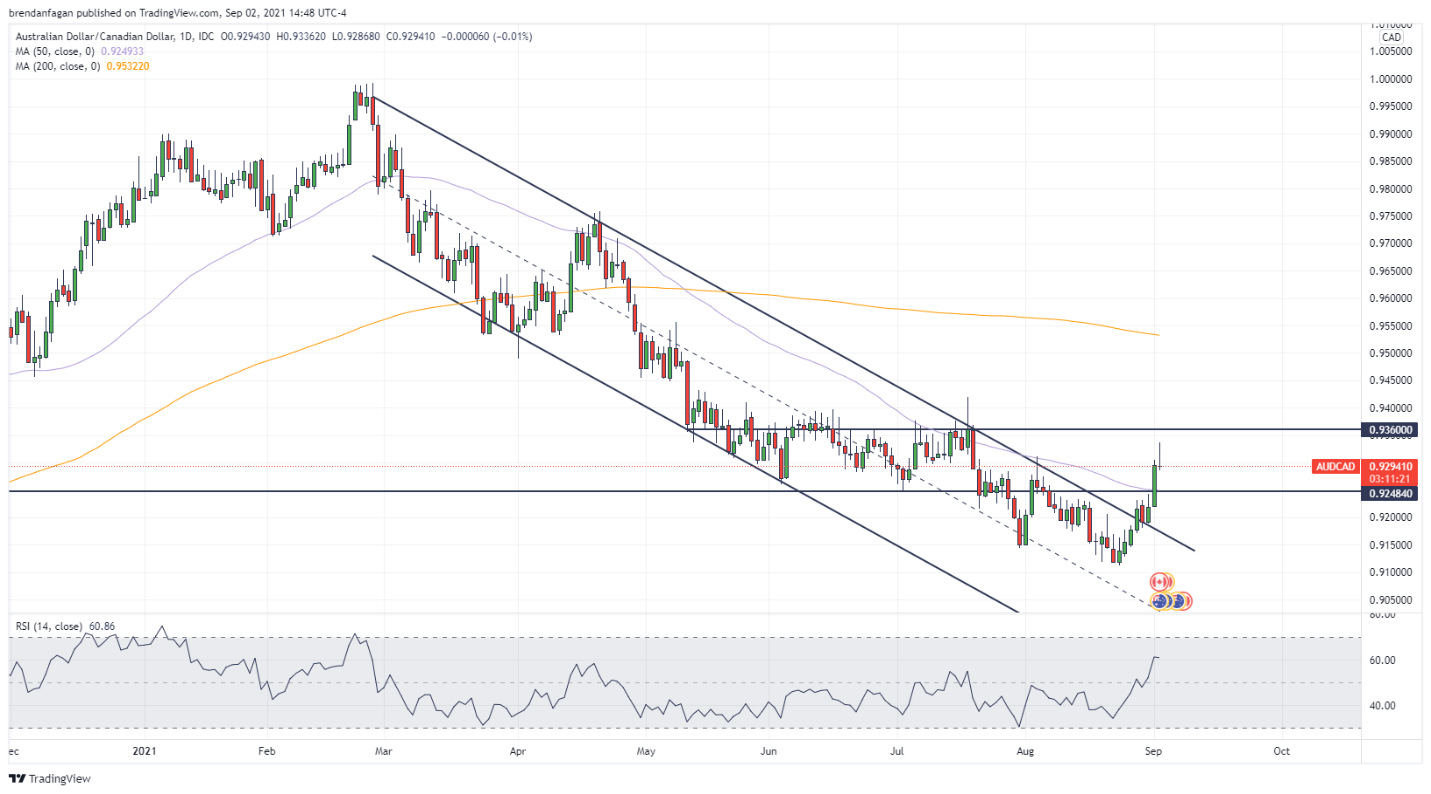
Chart created with TradingView
AUD/JPY Technical Analysis
Another Aussie pair seeing a robust reversal is AUD/JPY. With the pair having bottomed below 78.50 in mid-August, we now find ourselves trading north of 81.30. This massive rally off the yearly lows has seen the cross melt right through both trendline resistance and a key pivot level. The descending trendline from June which capped upside potential during the summer months proved no match for recent Aussie strength, with the pair also passing right through 85.75 on its charge higher. The pair now enters a key area of resistance around 81.50, an area that has proven to be impenetrable resistance during multiple tests in July and August. Should the pair trade through this key resistance zone, eyes may shift toward the 200-day moving average. Additional rejection at this level or a cool-off of the recent melt higher may see a retest of 80.75.
AUD/JPY Daily Chart
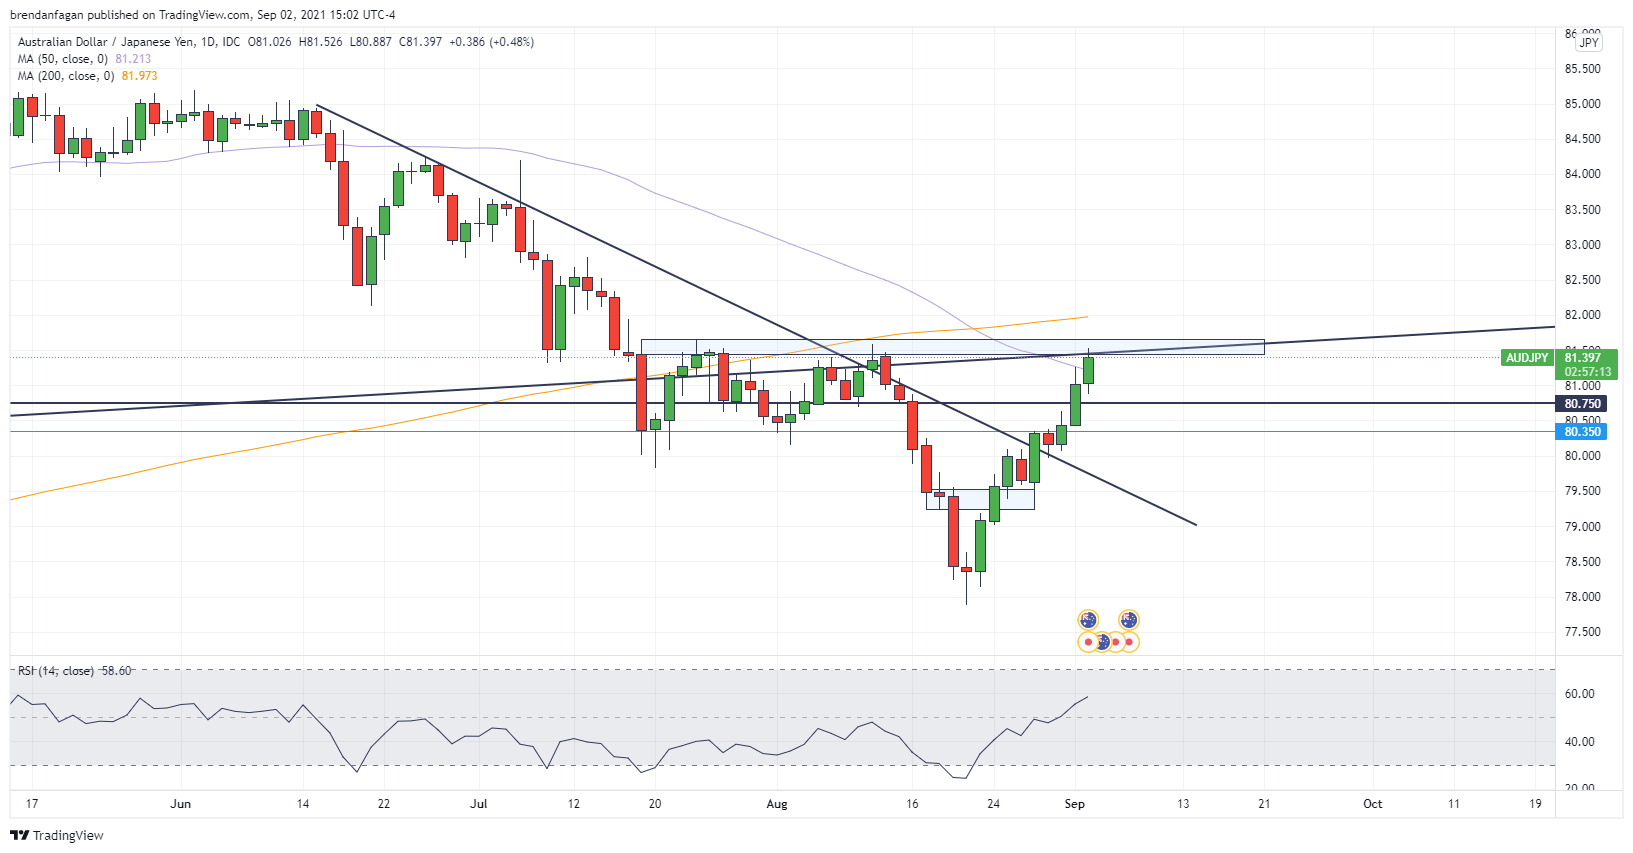
Chart created with TradingView

AUD/CHF Technical Analysis
AUD/CHF mirrors its counterpart, AUD/JPY. Following a break lower out of a multi-month descending channel, AUD/CHF made fresh yearly lows before making a robust move higher. The daily RSI fell as low as 25.44 on August 20th, perhaps hinting that a reversal was in the cards for the beaten-down pair. With the pair now approaching 0.6800, the pair could look to retest a key resistance zone it has failed at previously. Failure to make a sustained break through the resistance zone could see the pair retreat to support around 0.6621. Traders may look for a close above the 50-day moving average for any indication as to the validity of the current rally.
AUD/CHF Daily Chart

Chart created with TradingView

AUD/NZD Technical Analysis
Unlike the aforementioned Aussie crosses, AUD/NZD bias appears to remain skewed to the downside. Following a break of the head and shoulders formation in early July, the pair has continued to move lower. The pair has traded lower along the trendline of the right shoulder and has appeared to finally consolidate around 1.040. Weakness remains, with the pair making a fresh 2021 low on August 31 at 1.0346. The pair has since retraced slightly to the December 2020 swing low of 1.0418. The pair has since found that swing-low to be strong resistance, with any test being rejected. With bearish momentum continuing to prevail, a move lower could see the pair retest the April 2020 low of 1.0206. A reversal would need to see the pair break above the Dec. 2020 low, with the 50-day MA representing potential near-term resistance.
AUD/NZD Daily Chart
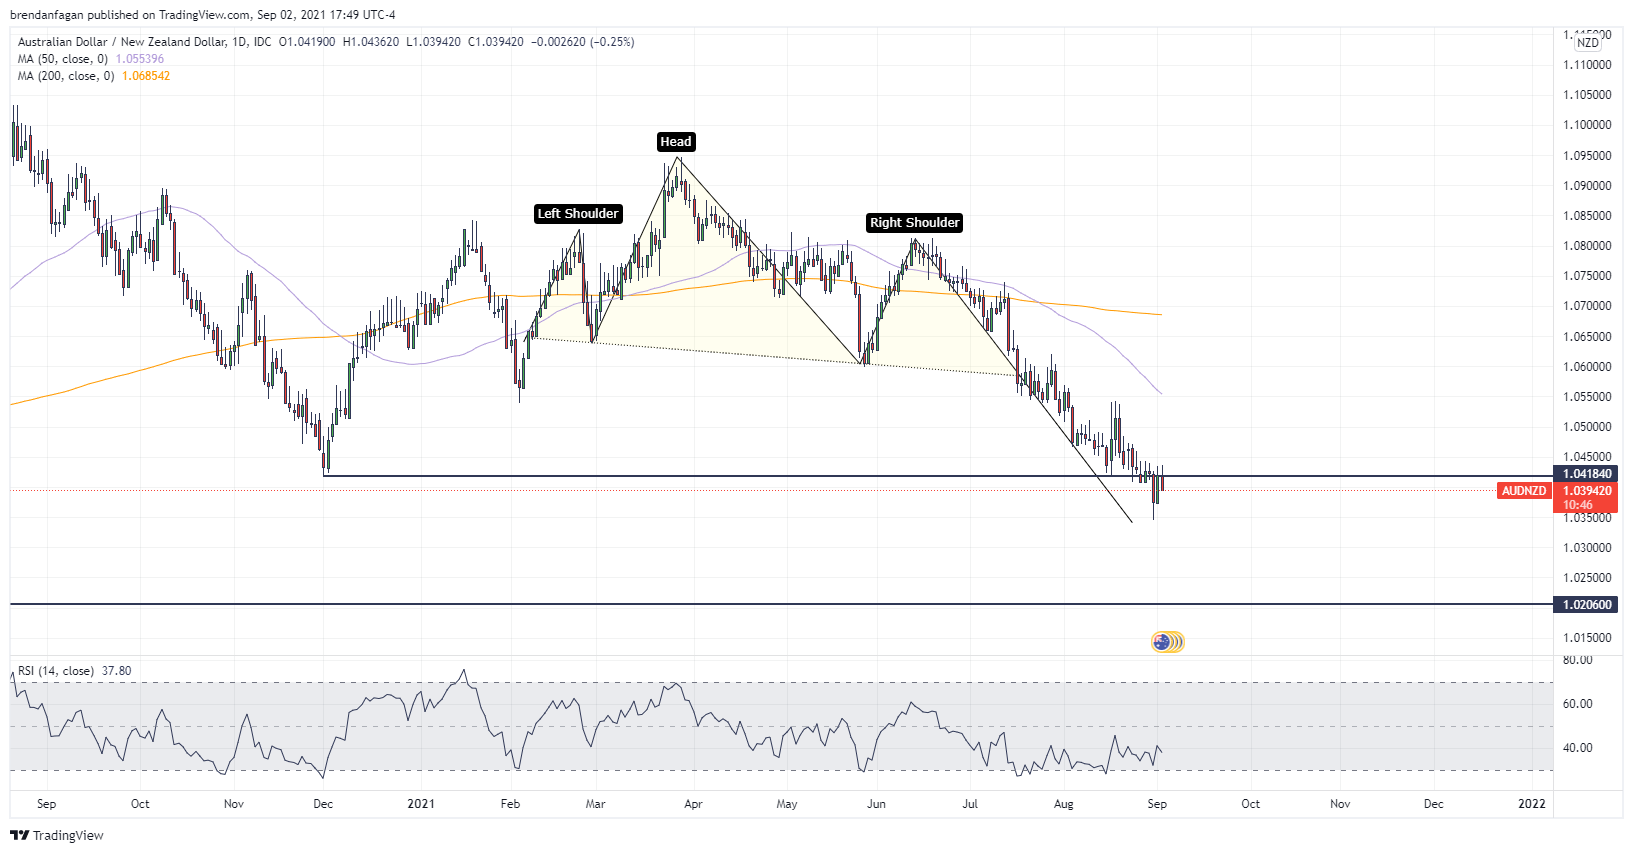
Chart created with TradingView
Resources for Forex Traders
Whether you are a new or experienced trader, we have several resources available to help you; indicator for tracking trader sentiment, quarterly trading forecasts, analytical and educational webinars held daily, trading guides to help you improve trading performance, and one specifically for those who are new to forex.
--- Written by Brendan Fagan, Intern
To contact Brendan, use the comments section below or @BrendanFaganFX on Twitter


