


British Pound, GBP/CHF, GBP/AUD, GBP/CAD, GBP/NZD – Talking Points
- GBP/CHF re-enters multi-month channel after bouncing off 200-DMA
- GBP/AUD breaks lower out of ascending channel, targeting 0.618 retracement
- GBP/CAD continues to oscillate above support, trend remains neutral
- GBP/NZD plummets through trendline, eyeing 200-DMA for fresh support

GBP/CHF Analysis
The British Pound has been mixed of late against its Swiss Franc counterpart, with much of recent trade being confined to a tight consolidated range between. Recent CHF strength in August propelled the pair through the floor of the strong channel it had carved out over the summer months, with a test of the 200-day moving average (MA) providing a reversal point. The re-entry into the sideways range may see the pair once again challenge the 50-day MA, and any break above that near-term resistance could see GBP/CHF test a longer-run descending trendline from March.
GBP/CHF Daily Chart
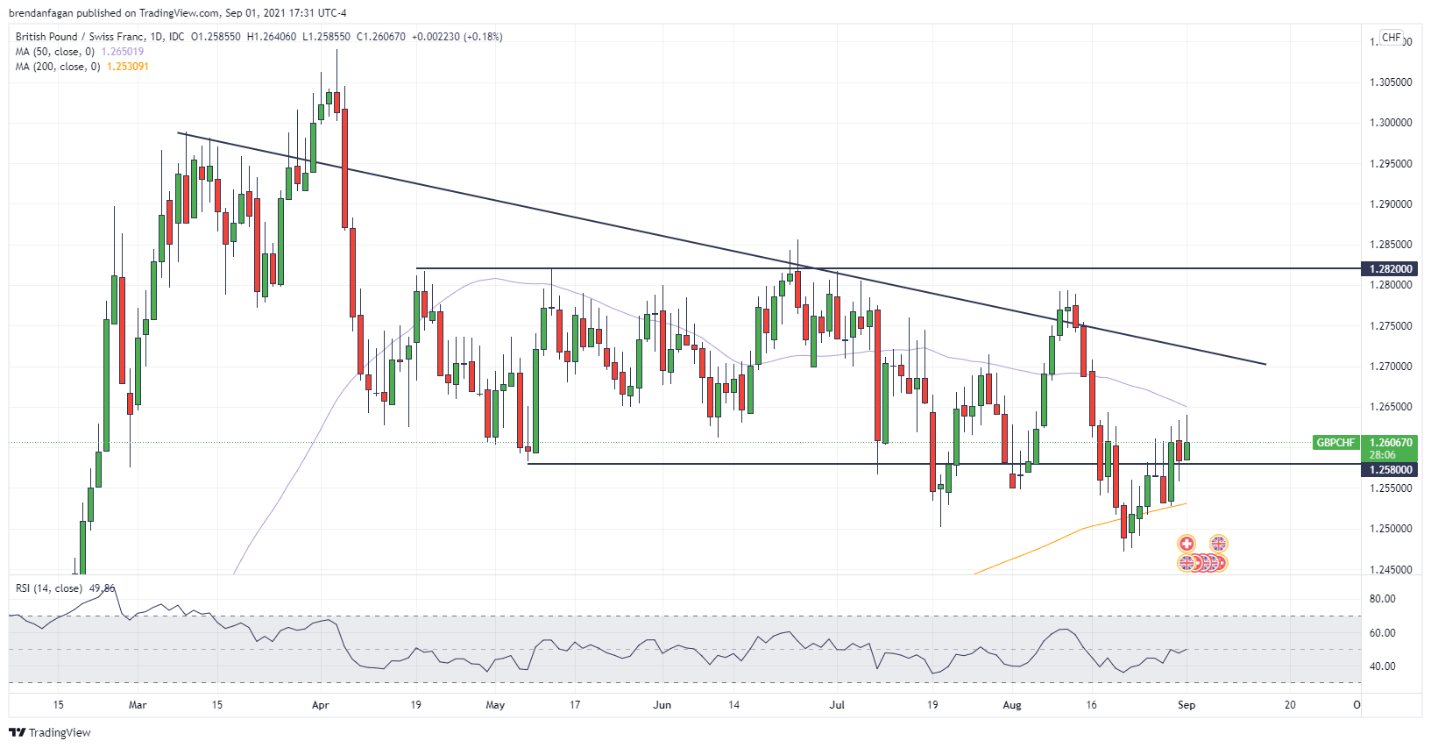
Chart created with TradingView

GBP/AUD Analysis
GBP/AUD has experienced a full-fledged reversal from yearly-highs over the last month, with the pair breaking through the floor of the ascending channel carved out between May and August. The pair confirmed the downtrend on September 1 by trading through the 50-day MA, eyeing the 0.618 Fibonacci retracement for support around 1.8614. The cool-off in GBP/AUD came as the pair traded into overbought territory on the RSI (relative strength index), with a reading of 75.75 marking the peak on August 20. With the retreat fully in motion, support remains at the aforementioned 0.618 Fib level. Any upside reversal may be capped by the 50-day MA, but the pair may fall lower with plenty of room remaining before GBP/AUD achieves oversold status.
GBP/AUD Daily Chart
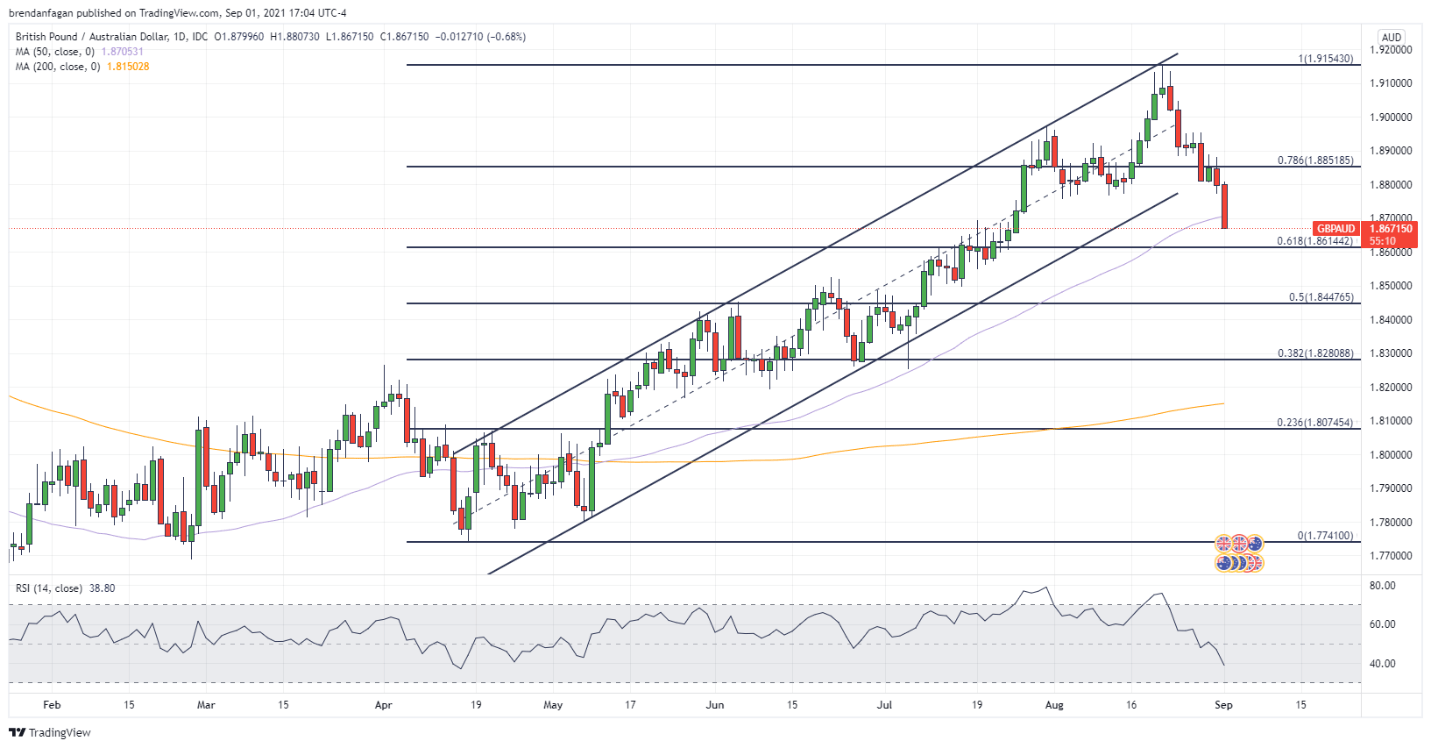
Chart created with TradingView

GBP/CAD Analysis
Despite GBP/CAD price action indicating sideways movement, bias should remain skewed to the upside, with the pair having traded back above long-term trendline resistance. As former resistance now becomes support, the pair may look to test the 0.618 Fib level above around 1.7458. The pair has found support recently in the form of the 0.5 Fib level as well as the 200-day MA, indicating market participants may want to explore higher prices. Of note, the 50-day MA crossed back above the 200-day MA for the first time since May 11, confirming that a move higher may potentially be on the cards. Upside momentum may also be stimulated by any continued weakness in oil prices.
GBP/CAD Daily Chart
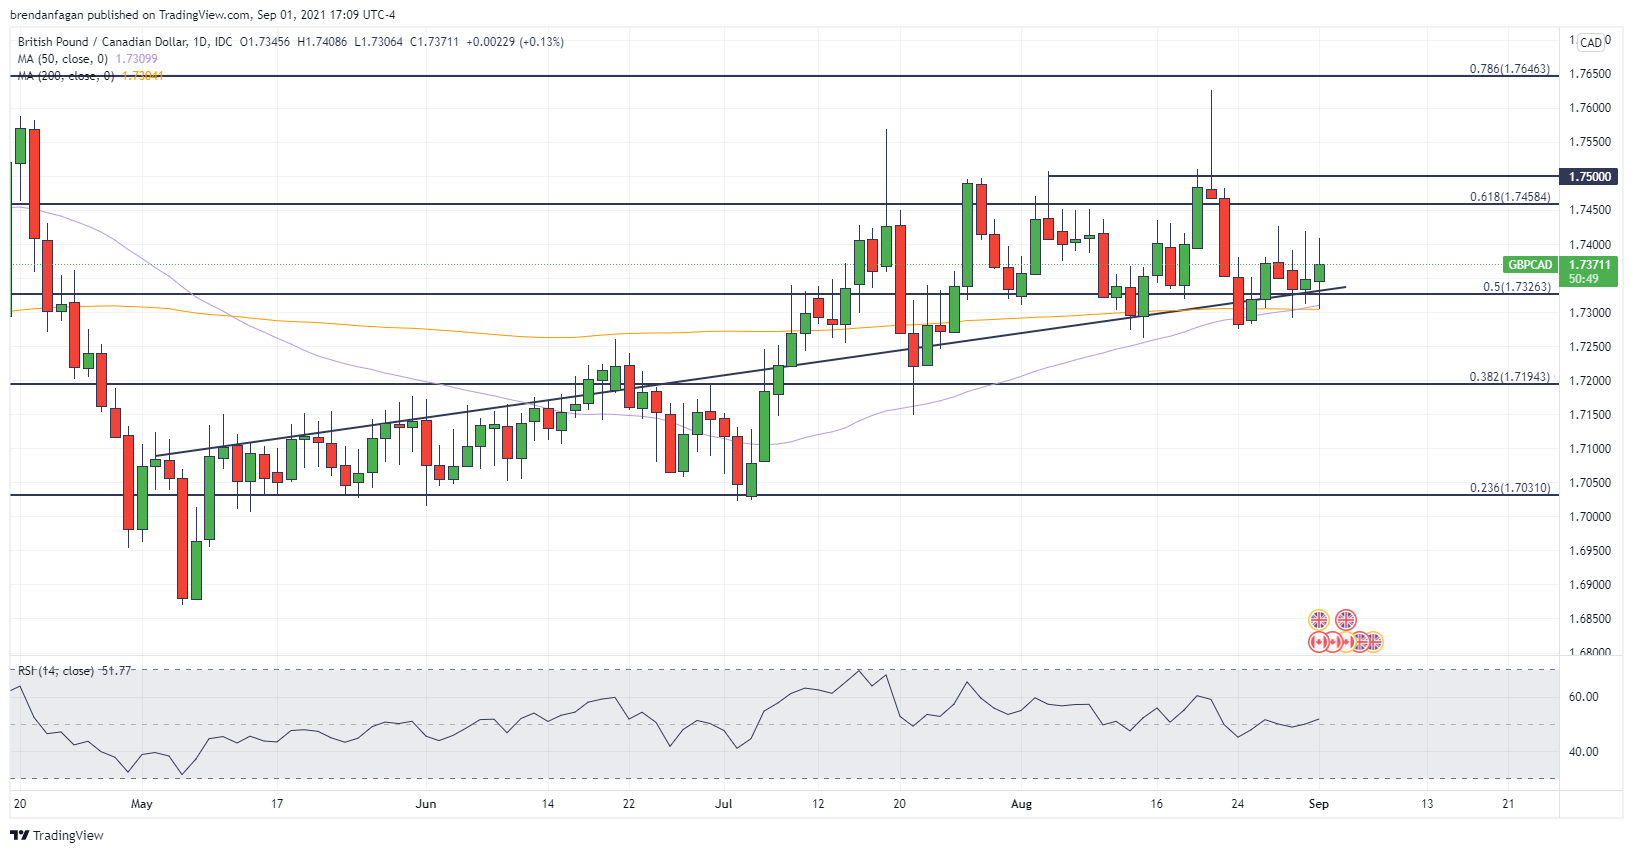
Chart created with TradingView

GBP/NZD Analysis
GBP/NZD finally broke key neckline support on what appeared to be a “never-ending” formation of a head and shoulders pattern. The break of neckline support ushered in a swift move to the downside, a move that has not yet cooled off. The pair may look to a test of the 200-day MA at 1.9399 for near-term support. Should the 200-day MA fall victim to the trend, price may stabilize around 1.9200, a level that proved to be crucial support during the pair’s swift decline in April. With the RSI approaching oversold territory, momentum remains skewed to the downside. Mean-reversion traders may look for a reading below 30 on the RSI and a test of the 200-day MA for an entry-point on any reversal trade. Resistance on any reversal remains the aforementioned trendline support above 1.9700.
GBP/NZD Daily Chart
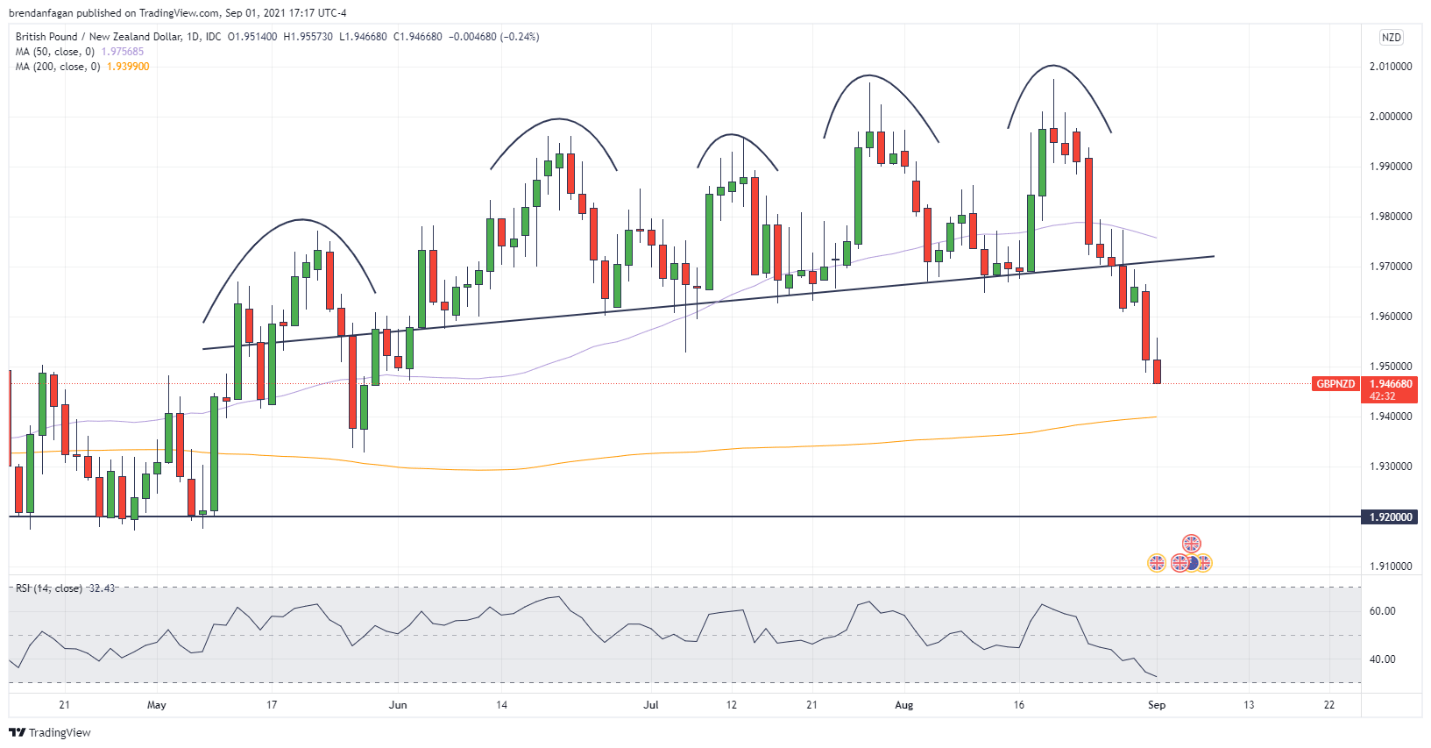
Chart created with TradingView
Resources for Forex Traders
Whether you are a new or experienced trader, we have several resources available to help you; indicator for tracking trader sentiment, quarterly trading forecasts, analytical and educational webinars held daily, trading guides to help you improve trading performance, and one specifically for those who are new to forex.
--- Written by Brendan Fagan, Intern
To contact Brendan, use the comments section below or @BrendanFaganFX on Twitter


