


NASDAQ 100, HANG SENG, ASX 200 INDEX OUTLOOK:
- Dow Jones, S&P 500 and Nasdaq 100 indexes closed +0.44%, +0.42% and +0.20% respectively
- Amazon beat EPS estimates, but forward guidance disappointed investors. The Nasdaq 100 futures fall
- Asia-Pacific markets are positioned to open mixed. Questions remain on whether HK stock rebound is sustainable

Amazon, Jobless Claims, HK Stock Rebound, Asia-Pacific at Open:
Wall Street equities edged broadly higher on Thursday as investors welcomed the Federal Reserve’s decision to remain status-quo at July’s FOMC meeting. Asia-Pacific markets however, may continue to trail behind their US peers due to lingering viral concerns and Beijing’s crackdown on technology and education firms. Mainland and Hong Kong stocks rebounded yesterday, but questions remain on whether the rally is sustainable.
Amazon released decent Q2 results after market close, but the company’s forward guidance disappointed investors. Similar to Intel and Apple, the pandemic winners are seeing their growth rates normalize in the second half of this year as economic reopening drives pent-up demand for outdoor activities amid a chip shortage. Nonetheless, US earnings season has fared well so far, with around 86% of S&P 500 companies beating analysts’ EPS forecasts.
Amazon:
- EPS at $15.12, versus $12.28 estimate (23% higher)
- Revenue at $113 billion, versus $115 billion estimate (1.7% lower)
- Share price tumbled 7% during after-hours trade as the company reported a slight revenue miss and gave weak third-quarter guidance
Nasdaq 100 Top 10 Stock Performance 29-07-2021
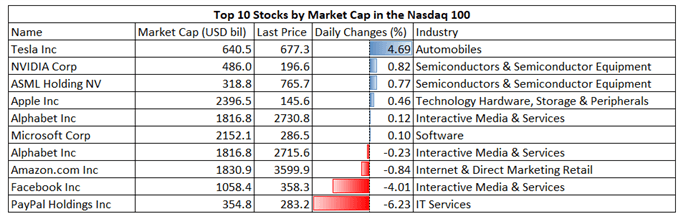
Source: Bloomberg, DailyFX
Meanwhile, weekly initial US jobless claims data fell short of expectations. Some 400k unemployment claims were filed last week, compared to a 380k estimate. The previous week’s figure was revised up to 424k from 368k. A slower-than-expected recovery in the labor market may serve to soothe tapering fears as Fed officials monitor both inflation and employment figures to set monetary policy.
US Weekly Jobless Claims
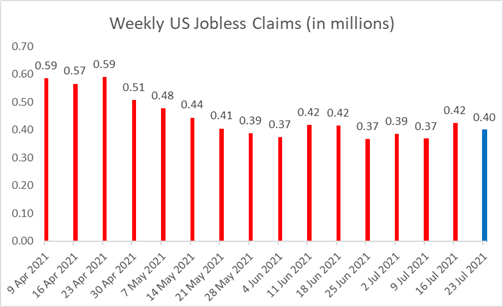
Source: Bloomberg, DailyFX
Asia-Pacific markets look set to end the week on a mixed tone. Futures in Japan, Australia, Hong Kong, South Korea, Malaysia are in the red, whereas those in mainland China, Taiwan, India and Thailand are higher.
Hong Kong’s Hang Seng Index (HSI) rebounded 3.3% on Thursday, but stock connections still registered HK$ 4.6 billion of outflow. This suggests that mainland investors are taking the recent rebound as an opportunity to sell amid fears about regulatory risks.
Hang Seng Index vs. Daily Southbound Net Flow
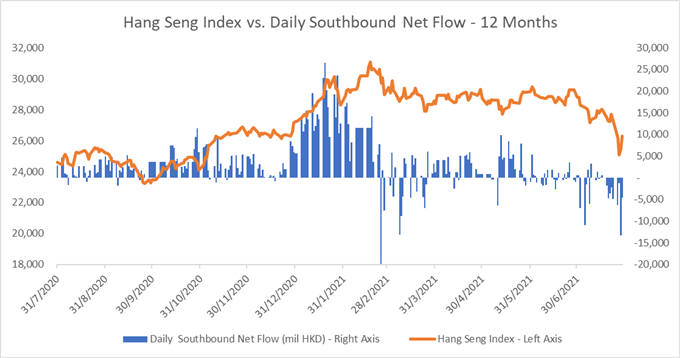
Source: Bloomberg, DailyFX
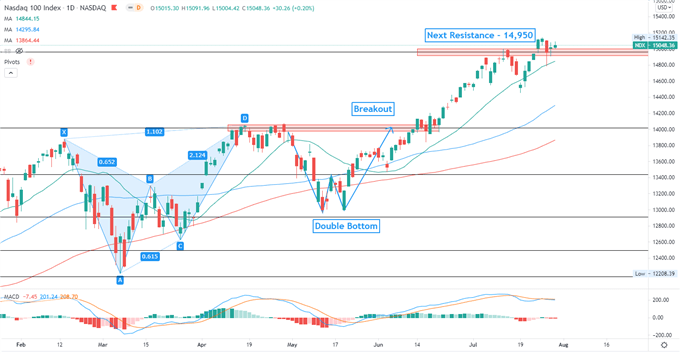
Nasdaq 100 Index Technical Analysis
The Nasdaq 100 index is attempting to breach a key resistance level at 14,950 for a second time. A successful attempt may open the door for further upside potential, whereas a pullback may lead to a test of the 20-Day SMA line for immediate support. The MACD indicator formed a bearish crossover and trended lower, suggesting that upward momentum may be fading.
Nasdaq 100 Index – Daily Chart
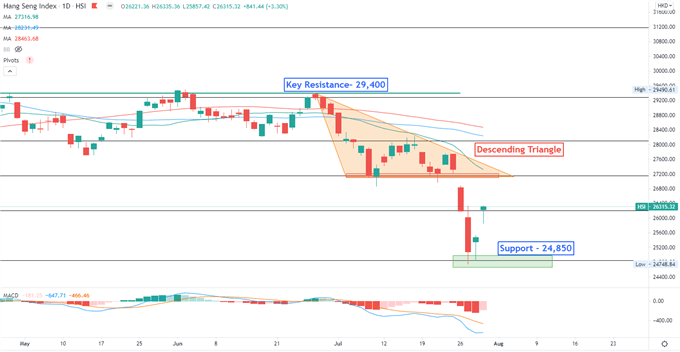
Hang Seng Index Technical Analysis:
The Hang Seng Index rebounded at a key support level of 24,850 after falling almost 10% in three days. Prices breached below the floor of a “Descending Triangle”, hinting at further consolidation ahead. The overall trend remains bearish-biased however, as the SMA lines have formed a “Death Cross” and trended lower. The MACD and RSI oscillators have both dived deeply in to the oversold territory, suggesting that a technical rebound is likely.
Hang Seng Index – Daily Chart
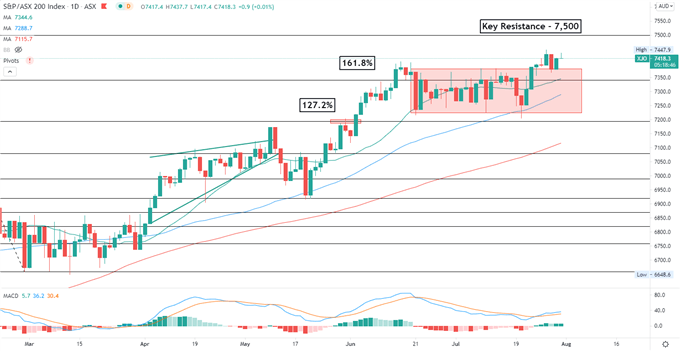
ASX 200 Index Technical Analysis:
The ASX 200 index breached the ceiling of the range-bound zone, as highlighted on the chart below. Breaking this level may open the door for further upside potential with an eye on 7,500. The overall trend remains bullish-biased, as suggested by the consecutive higher highs and higher lows formed over the past few months. The MACD indicator formed a bullish crossover and trended higher, suggesting that upward momentum is gaining traction.
ASX 200 Index – Daily Chart

--- Written by Margaret Yang, Strategist for DailyFX.com
To contact Margaret, use the Comments section below or @margaretyjy on Twitter


