


GOLD PRICE OUTLOOK:
- Gold prices rebounded to above $1,800 as the US Dollar fell to a two-week low
- The FOMC meeting will be in focus today, with markets anticipating only modest tweaks from June’s statement
- The world’s largest ETF saw 6.8 million shares of net outflow so far in July

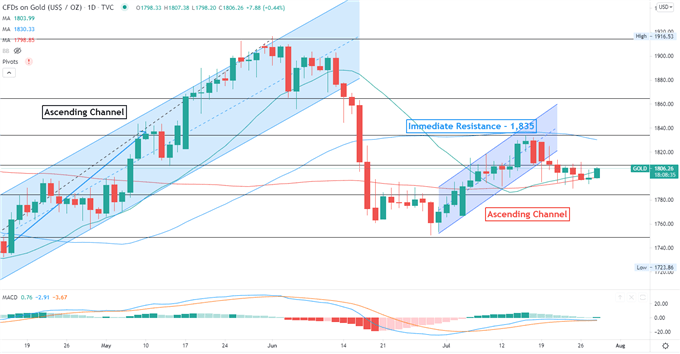
Gold Price - Daily
Gold prices rose 0.4% to $1,806 during Wednesday’smid-day session as investors awaited the results of a two-day FOMC meeting. Economists are anticipating only modest tweaks from June’s policy statement, with inflation, the pandemic and labor market conditions remaining in focus. Yet market participants are still keen to find clues about the central bank’s tapering timeline during Jerome Powell’s press conference.
The DXY US Dollar Index declined to a two-week low, reflecting the market’s view of a dovish-tilted Fed. Therefore, a less-dovish or hawkish-biased tone may lead to heightened market volatility and strengthen the Greenback, pulling gold prices lower. The reverse may be true if the meeting delivers dovish surprises.
The world’s largest gold ETF - SPDR Gold Trust (GLD) – saw its shares outstanding falling by 6.8 million so far this month, hinting that more sellers are returning to the bullion market. Gold prices and the number of outstanding GLD shares have exhibited a strong positive correlation in the past (chart below). Therefore, an accelerated pace of redemption to the ETF may be viewed as a bearish signal.
Gold Price vs. GLD ETF Shares Outstanding – 12 Months
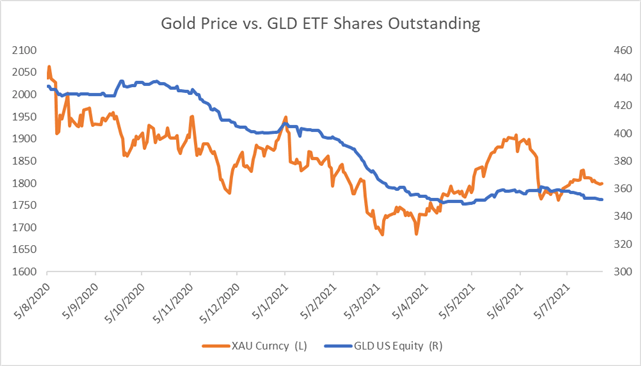
Source: Bloomberg, DailyFX
Gold Price Technical Analysis
Technically, gold prices have likely broken an “Ascending Channel” and entered a technical pullback. An immediate resistance level can be found at $1,835, whereas immediate supports can be found at $1,800 and then $1,794. The MACD indicator remains below the neutral midpoint, suggesting that bullish momentum may be weak.
| Change in | Longs | Shorts | OI |
| Daily | 1% | -3% | -1% |
| Weekly | 2% | -8% | -2% |
--- Written by Margaret Yang, Strategist for DailyFX.com
To contact Margaret, use the Comments section below or @margaretyjy on Twitter


