


GOLD PRICE OUTLOOK:
- Gold prices consolidated at around $1,808 as the US Dollar strengthened, yields gained
- The spread of the Delta variant dented global growth prospects, alleviating tapering fears
- Gold prices have likely broken an “Ascending Channel” and opened the door for further losses

Gold prices traded modestly lower during Wednesday’s APAC session amid a stronger US Dollar and higher yields. The DXY US Dollar Index surpassed the 93.00 mark, hitting the highest level seen in more than 3 months as traders pared back their bets on the Fed rate hikes. This came against the backdrop of the rapid spread of Delta variant of the Covid-19 virus around the globe, threatening lockdowns and tightened travel restrictions.
Singapore is the latest country that returned to lockdowns due to viral resurgence. The government suspended dining-in and restricted social gathering activity just two weeks after relaxing the rules, due to a few new clusters found. The city state has to return to lockdowns even though it has the highest vaccination rate across Asia. Over 70% of Singaporean people have received at least one dose of Covid-19 vaccine as of July 19th. This points to a bumpy road to recovery for other countries, which have far lower vaccination rates compared to Singapore (chart below).
A tempered economic outlook suggests that ultra-loose monetary policy may stay for a longer period of time. This may provide a supportive narrative for precious metals to stay afloat.
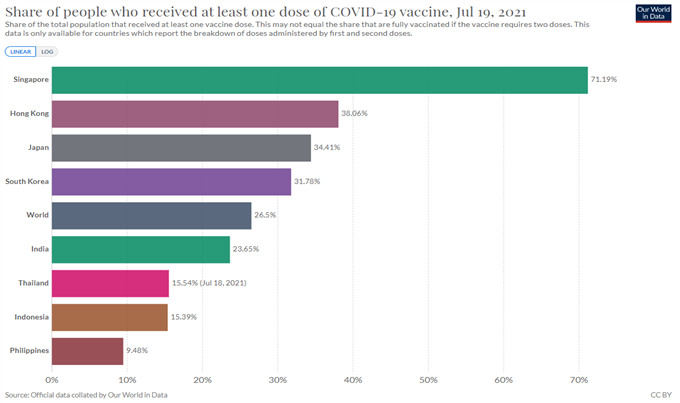
Source: our world in data
Separately, Treasury yields rebounded from 7-month lows, exerting downward pressure on bullion. Real yields (nominal-inflation), as represented by the rate on 10-year inflation-indexed securities, climbed 3bps overnight to -1.05% from -1.08% (chart below). Real yields and gold prices historically exhibited a negative relationship, as rising yields mean that the opportunity cost of holding the non-interest-bearing metal is higher.
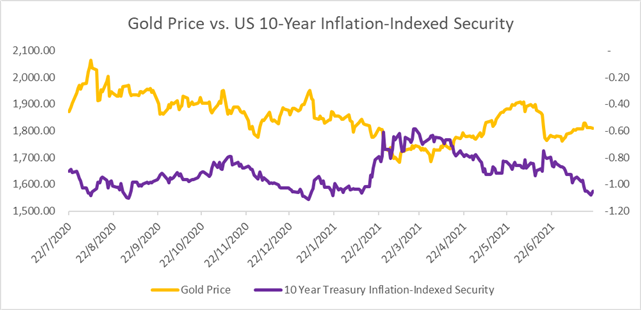
Source: Bloomberg, DailyFX
Gold Price Technical Analysis
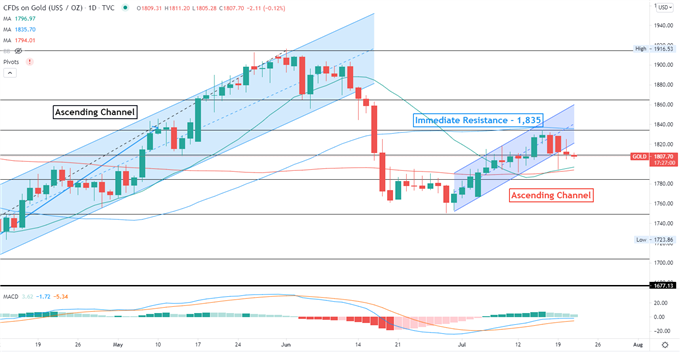
Technically, gold prices have likely broken an “Ascending Channel” and entered a technical pullback (chart below). An immediate resistance level can be found at $1,835, whereas immediate supports can be found at $1,810 and then $1,796. The MACD indicator remains below the neutral midpoint, suggesting that bullish momentum may be weak.
Gold - Daily Chart
| Change in | Longs | Shorts | OI |
| Daily | 1% | -3% | -1% |
| Weekly | 2% | -8% | -2% |
--- Written by Margaret Yang, Strategist for DailyFX.com
To contact Margaret, use the Comments section below or @margaretyjy on Twitter


