


Gold (XAU/USD) Analysis, Price, and Chart

Monday’s risk shake-out has seen gold nudge higher, despite ongoing US dollar strength and fears of sticky inflation. The precious metal hit a low of around $1,794/oz. on Monday before turning higher $20 higher in short order. The precious metal has stabilized today at around $1,814/oz. level and its short-term outlook will now be decided by the both moves in the US dollar and the overall risk tone in the market. All eyes will be on next week’s FOMC meeting.
For all market-moving news and data releases, see the DailyFX Economic Calendar
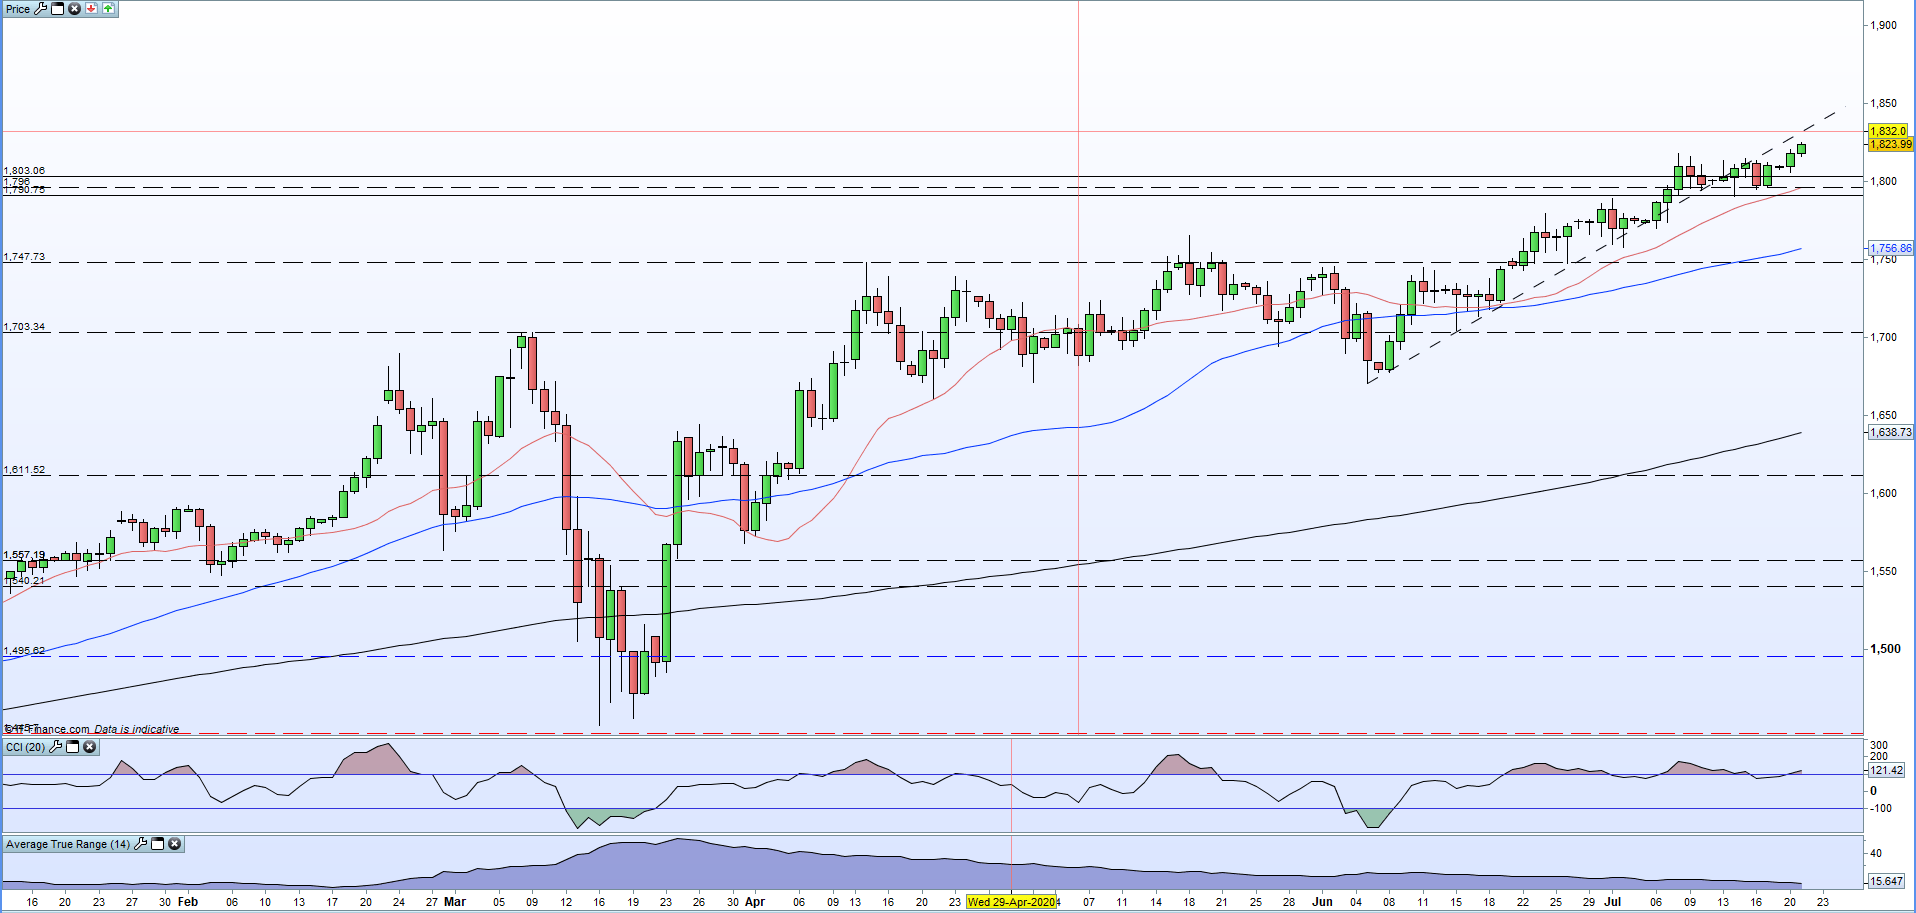
The daily chart shows that gold has fallen through recent channel support and this may prove difficult to regain in the short term. All three moving averages are muddled, giving a mixed-signal, while the CCI indicator is also giving a neutral signal. Volatility remains low. If gold’s safe-haven status resumes, prices may drift higher but the upside, and the downside, both remain limited ahead of the Fed unless there is another risk event.
Gold Daily Price Chart (September 2020 – July 20, 2021)
| Change in | Longs | Shorts | OI |
| Daily | 1% | -3% | -1% |
| Weekly | 2% | -8% | -2% |
Client sentiment data show 84.66% of traders are net-long with the ratio of traders long to short at 5.52 to 1. The number of traders net-long is 7.76% lower than yesterday and 7.25% lower from last week, while the number of traders net-short is 3.64% higher than yesterday and 13.90% lower from last week.
We typically take a contrarian view to crowd sentiment, and the fact traders are net-long suggests Gold prices may continue to fall.Positioning is less net-long than yesterday but more net-long from last week. The combination of current sentiment and recent changes gives us a further mixed Gold trading bias.
What is Market Sentiment and How Does it Work?
What is your view on Gold – are you bullish or bearish?? You can let us know via the form at the end of this piece or you can contact the author via Twitter @nickcawley1.


