


NZD/USD Analysis:
- Reserve Bank of New Zealand to provide update on monetary policy interventions and unlikely to alter the official cash rate
- ‘Death cross’ on IG charts opens the door to lower price action should the trading range break down
- IG Client Sentiment indicator reveals an increase in longs around crucial support zone
Since NZD/USD is heavily reliant on the US dollar, read the full US Dollar forecast including the technical outlook. Download our new 3Q trading guide from the DailyFX Free Trading Guides below.

Reserve Bank of New Zealand to Provide Update on Current Monetary Policy
The RBNZ is set to update the public on accommodative monetary policy measures and tools that are currently being deployed to boost the local economy in the wake of the coronavirus and the spread of the Delta variant making its way around the world.
While no change to the interest rate is expected, the bank will assess whether it is necessary to reign in the Large Scale Asset Purchase and Funding for Lending programs. CPI currently sists at 1.5%, squarely in between the 1% - 2% range but unemployment remains below the maximum sustainable level set out by the bank.
Main Risk Events Next Week

For all market-moving data releases and events see the DailyFX Economic Calendar
Key Technical Levels for NZD/USD
The weekly chart highlights the bullish exhaustion that has played out since the February 2021 high as prices have failed to attempt a move higher. However, a series of lower lows has emerged but overall price action appears to be moving sideways. More recent price action has been bearish and now rests on the crucial support zone around 0.6900 – 0.6940.
NZD/USD Weekly Chart

Chart prepared by Richard Snow, IG

The daily chart highlights the emergence of what appears to be a trading range between 0.7100 and the zone of support at 0.6940. The RSI indicator hints at range continuation as it reveals positive divergence (RSI making higher lows while price action traded to roughly the same low). Should we witness a continued move higher as a result, the psychological 0.7000 level, the 0.7060 level and possibly even the upper bound of the range at 0.7000 may come into play as resistance.
However, the appearance of a death cross (50 SMA crossing below the 200 SMA) indicates that if the USD is to strengthen further, it could result in a lower move and possibly even a break below the existing trading range upon which, 0.6791 (resistance for much of H2 2020) becomes the next level of support.
NZD/USD Daily Chart
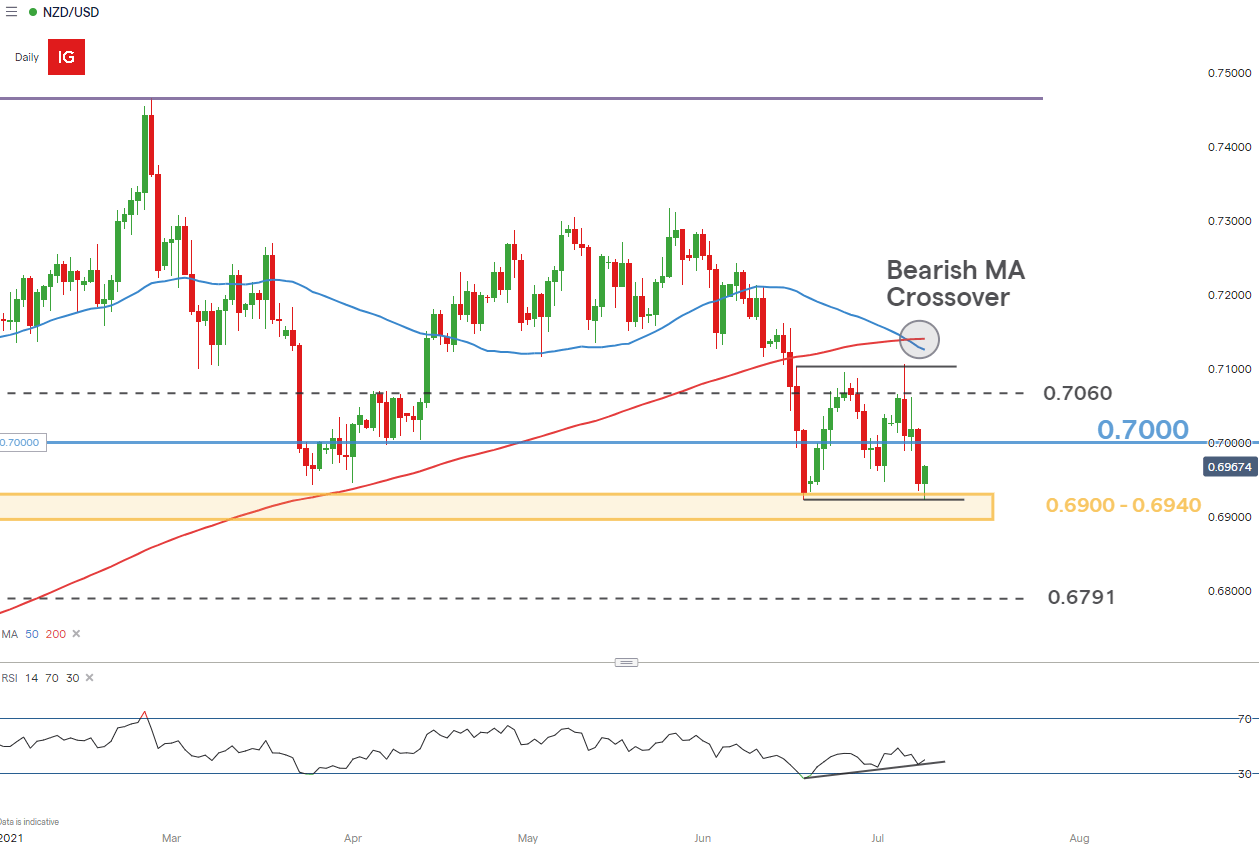
Chart prepared by Richard Snow, IG
Contrarian Indicator Reveals Increased Longs around Crucial Support Zone
| Change in | Longs | Shorts | OI |
| Daily | 6% | -13% | 2% |
| Weekly | 40% | -35% | 15% |
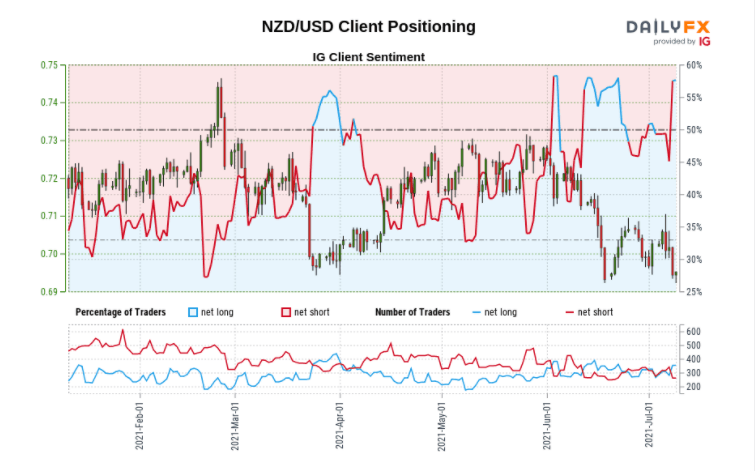
At the time of writing NZD/USD retail trader data shows 56.75% of traders are net-long with the ratio of traders long to short at 1.31 to 1.
We typically take a contrarian view to crowd sentiment in strong trending environments. Since this isn’t a strong trending environment, contrarian signals provided by client sentiment tend to be less reliable.
In fact, in ranging markets, it makes more sense to buy at the bottom and sell at the top when levels of support and resistance are well established.
Therefore, a clear breakout/breakdown is required to spark a fresh trend and until then traders can look to the sentiment indicator to gauge shorter term changes in long and short positioning for clues on trading the range.
--- Written by Richard Snow for DailyFX.com
Contact and follow Richard on Twitter: @RichardSnowFX


