


BITCOIN FORECAST: BTC/USD PRICE FORMS PENNANT CHART PATTERN
- Bitcoin price action has attempted to rebound and unwind the sharp selloff
- BTC/USD volatility might accelerate with a break of the pennant chart pattern
- Visit our Education Center or check out this insight on major cryptocurrencies
Bitcoin (BTC/USD) has ping-ponged back and forth over recent trading sessions in search of its next big move. The cryptocurrency now looks coiled into a tightly wound spring as BTC/USD price action fluctuates between two converging trendlines. This brings to focus potential for Bitcoin volatility to accelerate following a breakout from the pennant pattern that appears to have formed.
BTC/USD – BITCOIN PRICE CHART: DAILY TIME FRAME (25 FEBRUARY TO 01 JUNE 2021)
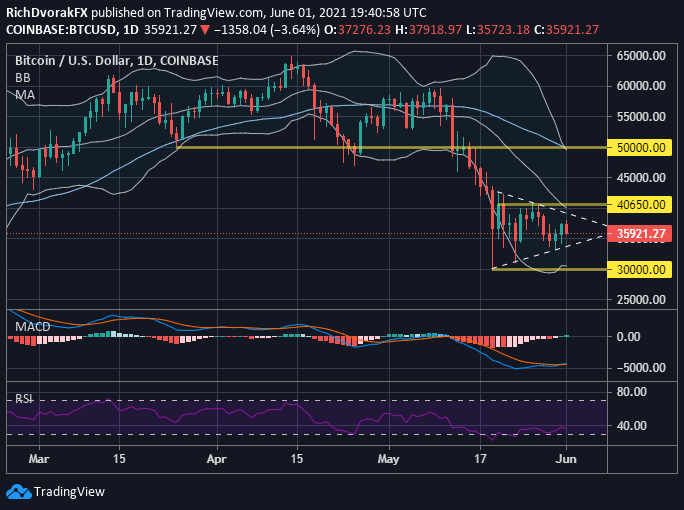
Chart by @RichDvorakFX created using TradingView
Bitcoin bulls and bears have been clashing over where the crypto heads next as price action consolidates following a -50% selloff from all-time highs. A string of higher lows are forming from rebound efforts off the $30,000-price level, but this is mired by consecutively lower highs amid prevailing downward pressure. As such, it is worth keeping in mind that one distinct characteristic of a pennant pattern is the ‘flagpole’ that precedes the pennant. It is also important to remember this chart pattern, generally speaking, indicates strong potential for a continuation of the recent trend (i.e. direction of the flagpole).

BTC/USD – BITCOIN PRICE CHART: WEEKLY TIME FRAME (10 FEBRUARY 2020 TO 01 JUNE 2021)
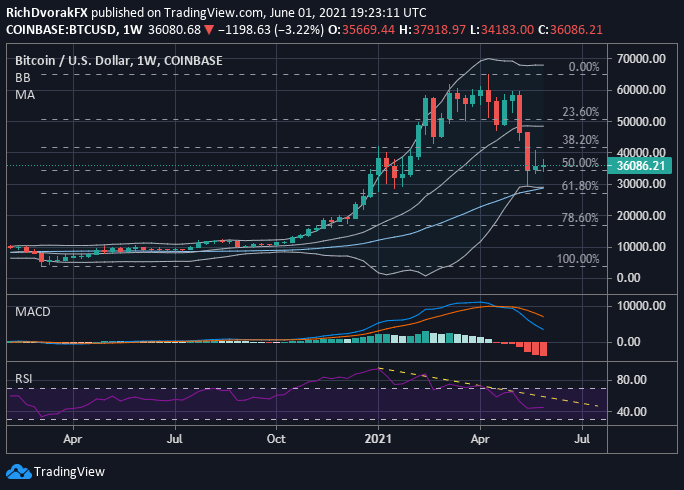
Chart by @RichDvorakFX created using TradingView
BTC/USD price outlook thus seems to leave the cryptocurrency at risk of extending lower in the short-term. This bearish scenario could warrant more credence if Bitcoin bears can invalidate ascending trendline support. That said, the $30,000-price level looks like a formidable layer of defense and may help keep BTC/USD afloat. Failure to maintain this area of support likely exposes the $17,000-handle underpinned by the 78.6% Fibonacci retracement level of Bitcoin’s March 2020 to April 2021 trading range. If Bitcoin can overcome nearside technical resistance with a close above the $40,650-price level, however, this might open up the door for bulls to make a push toward $50,000.

-- Written by Rich Dvorak, Analyst for DailyFX.com
Connect with @RichDvorakFX on Twitter for real-time market insight


