


Bitcoin (BTC/USD) Forecast:
- Bitcoin loses ground as US Treasury Yields ease
- BTC/USD remains supported by mainstream companies
- FOMC may further catalyze BTC/USD price action
Major cryptocurrencies have continued to outperform traditional assets, buoyed by an increase in the adoption of Bitcoin as an acceptable method of payment by mainstream players. However, after six consecutive months of gains, Bitcoin bulls are under pressure as BTC/USD struggles to trade back above the key psychological level of $60,000, a level which continues to hold bulls at bay.

Source: Refinitiv
Although the inherent value of BTC/USD remains a controversial topic, speculation and crowd psychology remain the primary catalysts for Bitcoin price action as a retest of last month’s cannot be ruled out. However, given the fact that Bitcoin prices surged approximately 1121% between the March 2020 low and the March 2021 record high of $61,759, the ability for bulls to maintain the upward trajectory remains questionable.

Bitcoin (BTC/USD) Technical Analysis
Recently, Bitcoin has been trading within a well-defined range, with price action consolidating between $53,395 (the 14.4% Fibonacci retracement level of the 2020 – 2021 move) and the key psychological barrier of $60,000.
Bitcoin (BTC/USD) Weekly Chart
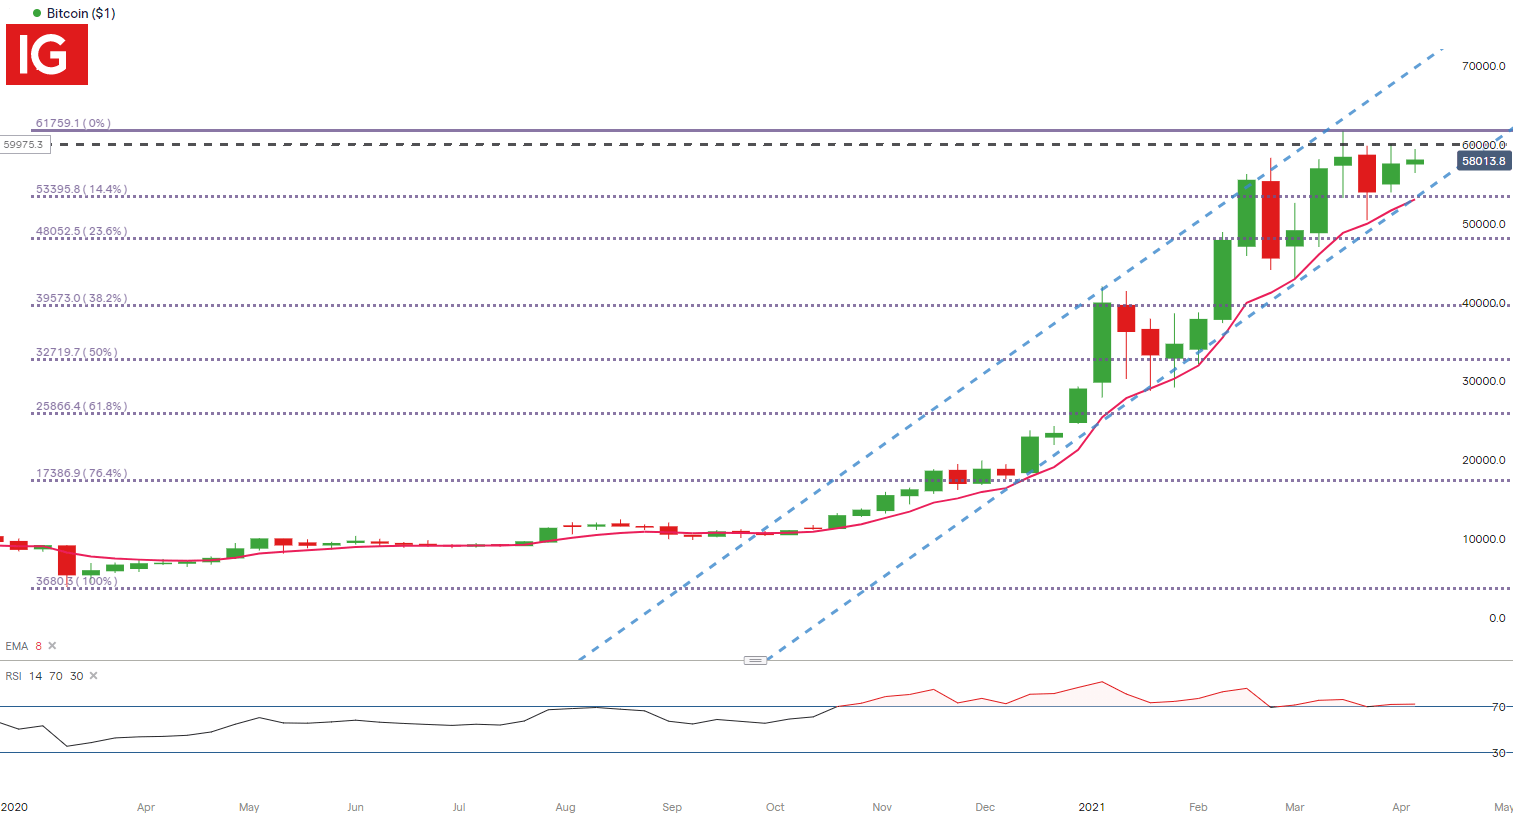
Chart prepared by Tammy Da Costa, IG
Although the upward trend from last year remains intact, with BTC/USD still tracking the positive slope reflected by the 8-period EMA, recent RSI divergence indicates that the bullish momentum could be losing steam.

Bitcoin(BTC/USD) Daily Chart
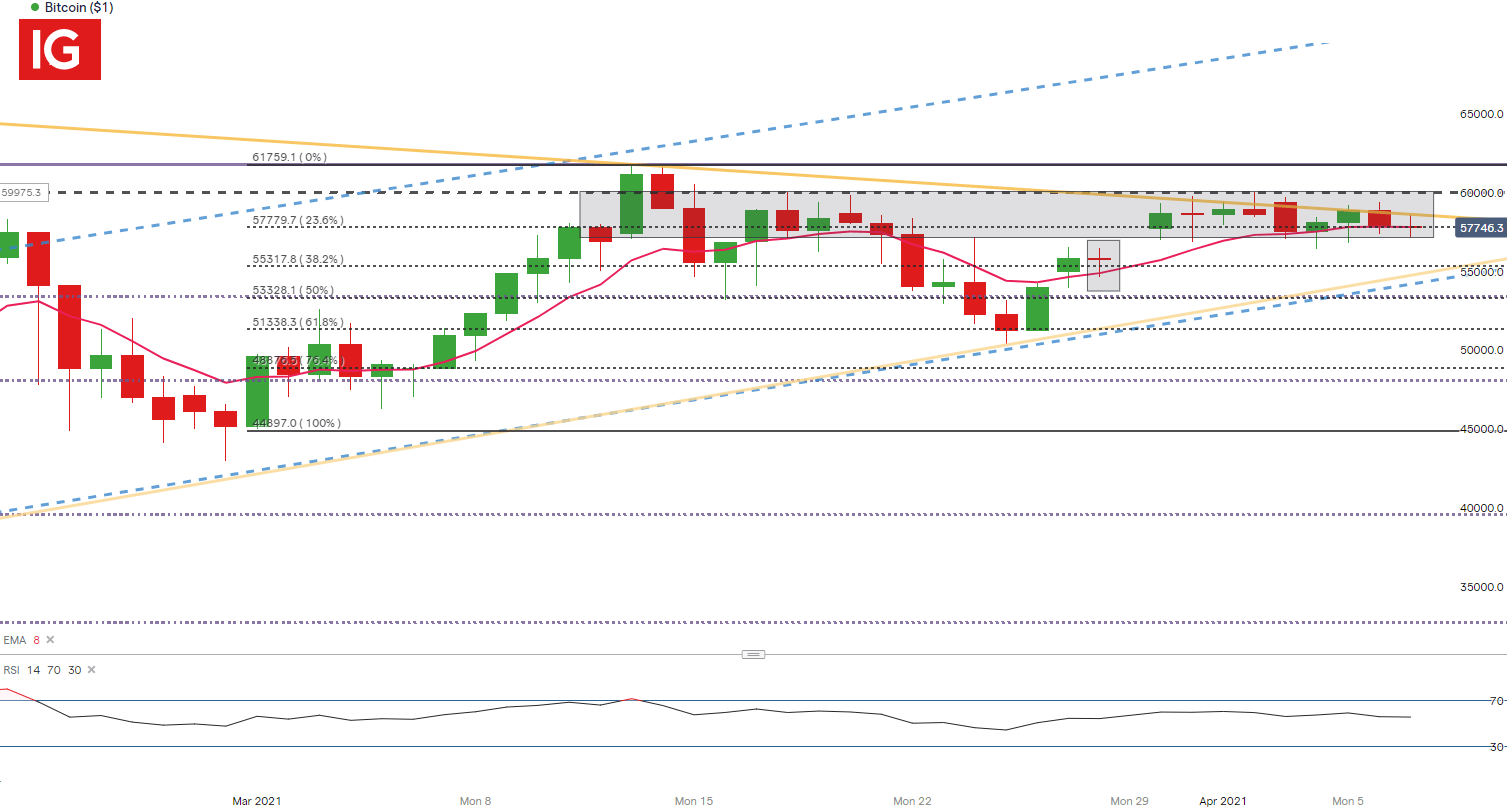
Chart prepared by Tammy Da Costa, IG
For the more imminent move, the formation of a symmetrical triangle on the daily timeframemay keep Bitcoin within a tight range, with recent price action bouncing between prior support of $57,779 (the 23.6% retracement of the March 2021 move) and $60,00.
It seems as thoughthe stabilization of US Treasury Yields have hindered the advance in BTC/USD, allowing bears to drive prices below support and towards a next key level of $55,000. With prices hovering just above the 8-period EMA, the FOMC meeting minutes may assist in the catalyzation of short-term move.

--- Written by Tammy Da Costa, Market Writer for DailyFX.com
Contact and follow Tammy on Twitter: @Tams707


