


Gold Prices, US Treasury Yields, XAU/USD, Federal Reserve, Yield Curve Control – Talking Points:
- Positive vaccine progress, rising inflation expectations and fiscal stimulus hopes have sent long-term Treasury yields soaring higher.
- The lack of concern from the Federal Reserve could open the door for yields to move even higher, and in turn weigh on gold prices.
Gold prices have ground consistently lower over the last six months, after storming to fresh record highs in August of 2020. This prolonged period of weakness appears to have been driven by a consistent, sustained rise in long-term nominal yields over the last six months, on the back of the impending provision of additional fiscal stimulus, rising inflation expectations and positive coronavirus vaccine progress.
Indeed, Bullion’s peak appears to coincide with US 30-year yields bottoming out in early-August of last year, which suggests that gold prices may continue to slide lower if long-term rates extend recent gains. Given the substantial amount of stimulus being readied by the Biden administration, the amount of Treasury issuances may well top last year’s amount.
In 2020, lawmakers passed the $2.2 trillion CARES Act bill in March, with an additional $900 billion distributed in December. This year, President Biden is expected to succeed in passing his $1.9 trillion coronavirus-relief package through the reconciliation process, and follow that up with an infrastructure spending plan as large as $3 trillion.
Gold Price vs US 30-Year Treasury Yields
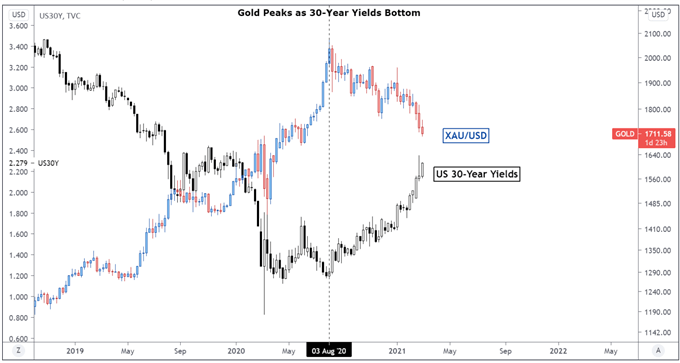
Chart created using Tradingview
Therefore a wave of fresh debt issuances would probably undermine bond prices even further, in the absence of the Federal Reserve tweaking its current rate of bond purchases or looking to implement a form of Yield Curve Control (YCC) to cap long-term rates.
However, recent comments from several Fed members suggest that the central bank may hold fire for the time being, with Chicago Fed President Charles Evans – one of the more dovish members of the FOMC – stating that he was unworried about the rise in long-term bond yields.
This reinforced Richmond Fed President Thomas Barkin’s view that “if the driver [behind the recent move in Treasuries] is news about vaccines, or news about the health of the economy, or news about fiscal stimulus, then I think it is a natural reaction”.
Attention now turns to Chairman Jerome Powell’s upcoming speech, with a lack of regard surrounding bond markets probably sending yields higher, and in turn putting further downward pressure on gold prices. On the other hand, any mention of YCC or increasing the rate of the central bank’s bond purchasing program could fuel inflows into Treasury markets and pave the way for Bullion to recover lost ground.
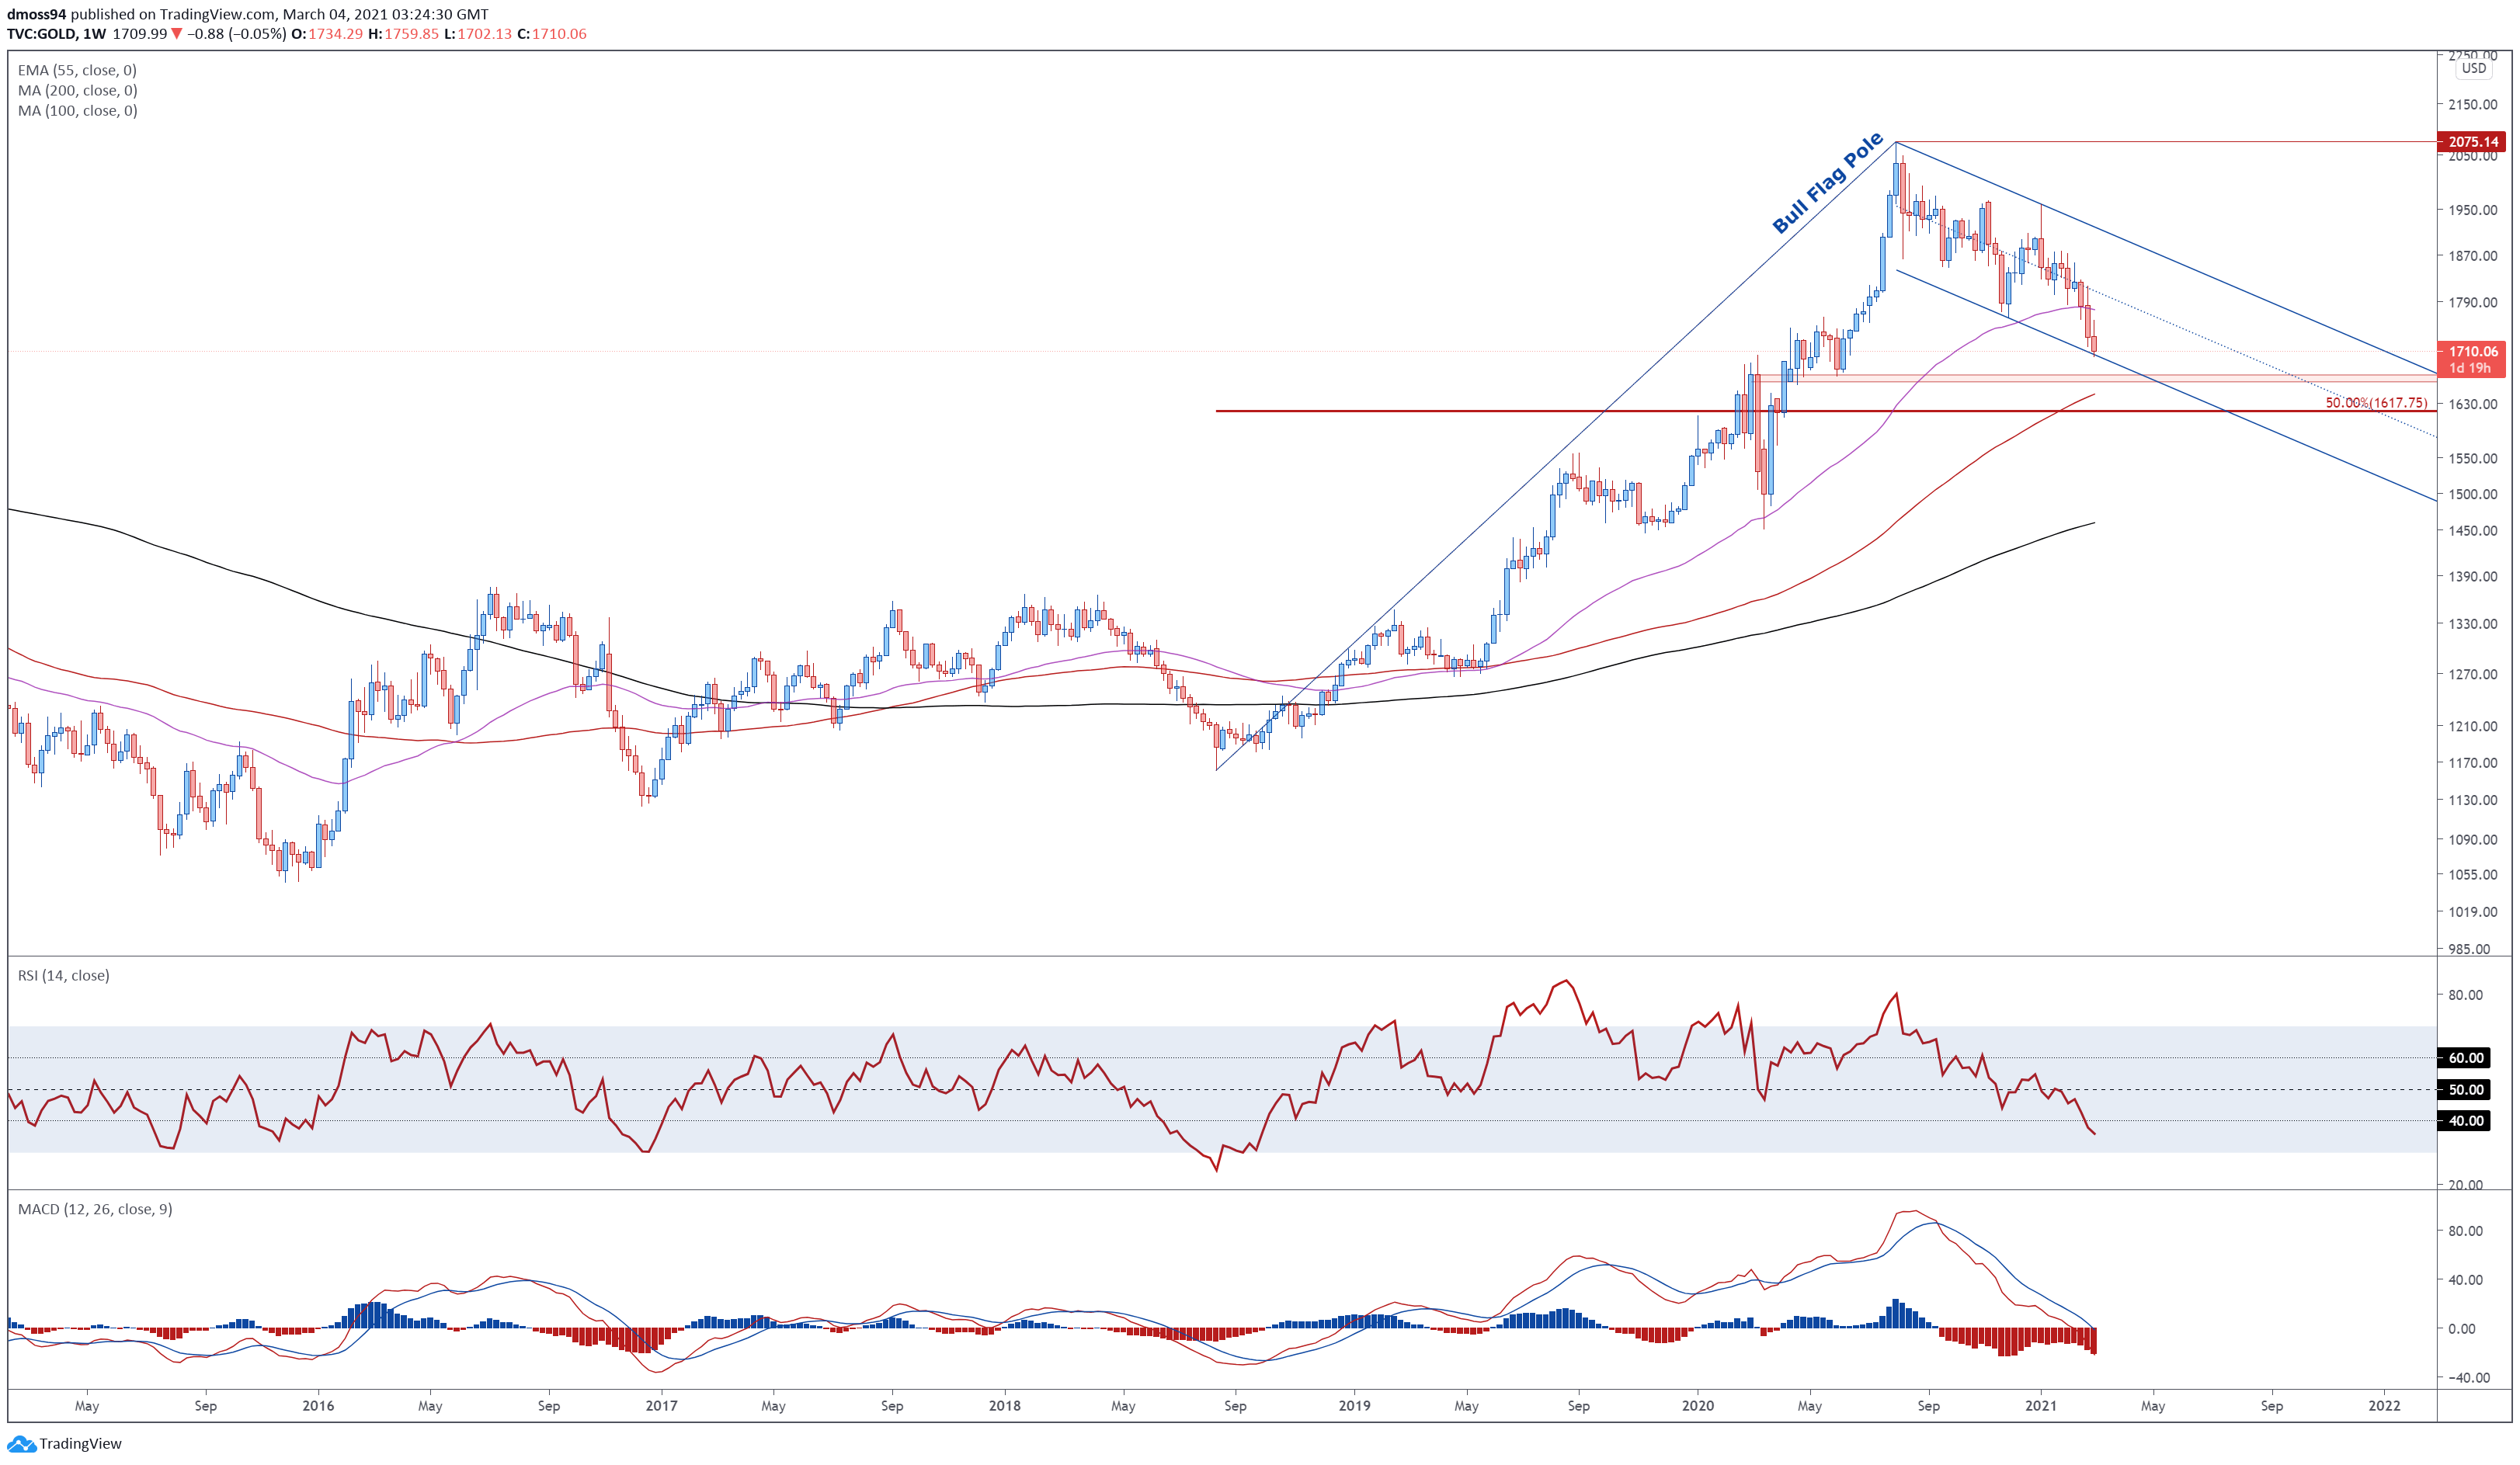
US 30Y Yields Weekly Chart – 200-MA in Focus

US30Y weekly chart created using Tradingview
From a technical perspective, yields on US 30-year Treasuries look set to continue climbing higher, as price surges above the 55-EMA (1.77) for the first time since late 2018, and storms above former support-turned-resistance at 2%.
With the RSI surging to its highest levels since December 2016, the path of least resistance seems higher. A convincing break above 2.4% would probably ignite a push to fulfil the Double Bottom pattern’s implied measured move (2.58%) and put further downward pressure on Bullion prices.
Alternatively, failing to hurdle 2.4% could trigger a counter-trend pullback towards psychological support at 2%, and put a short-term premium on gold prices.
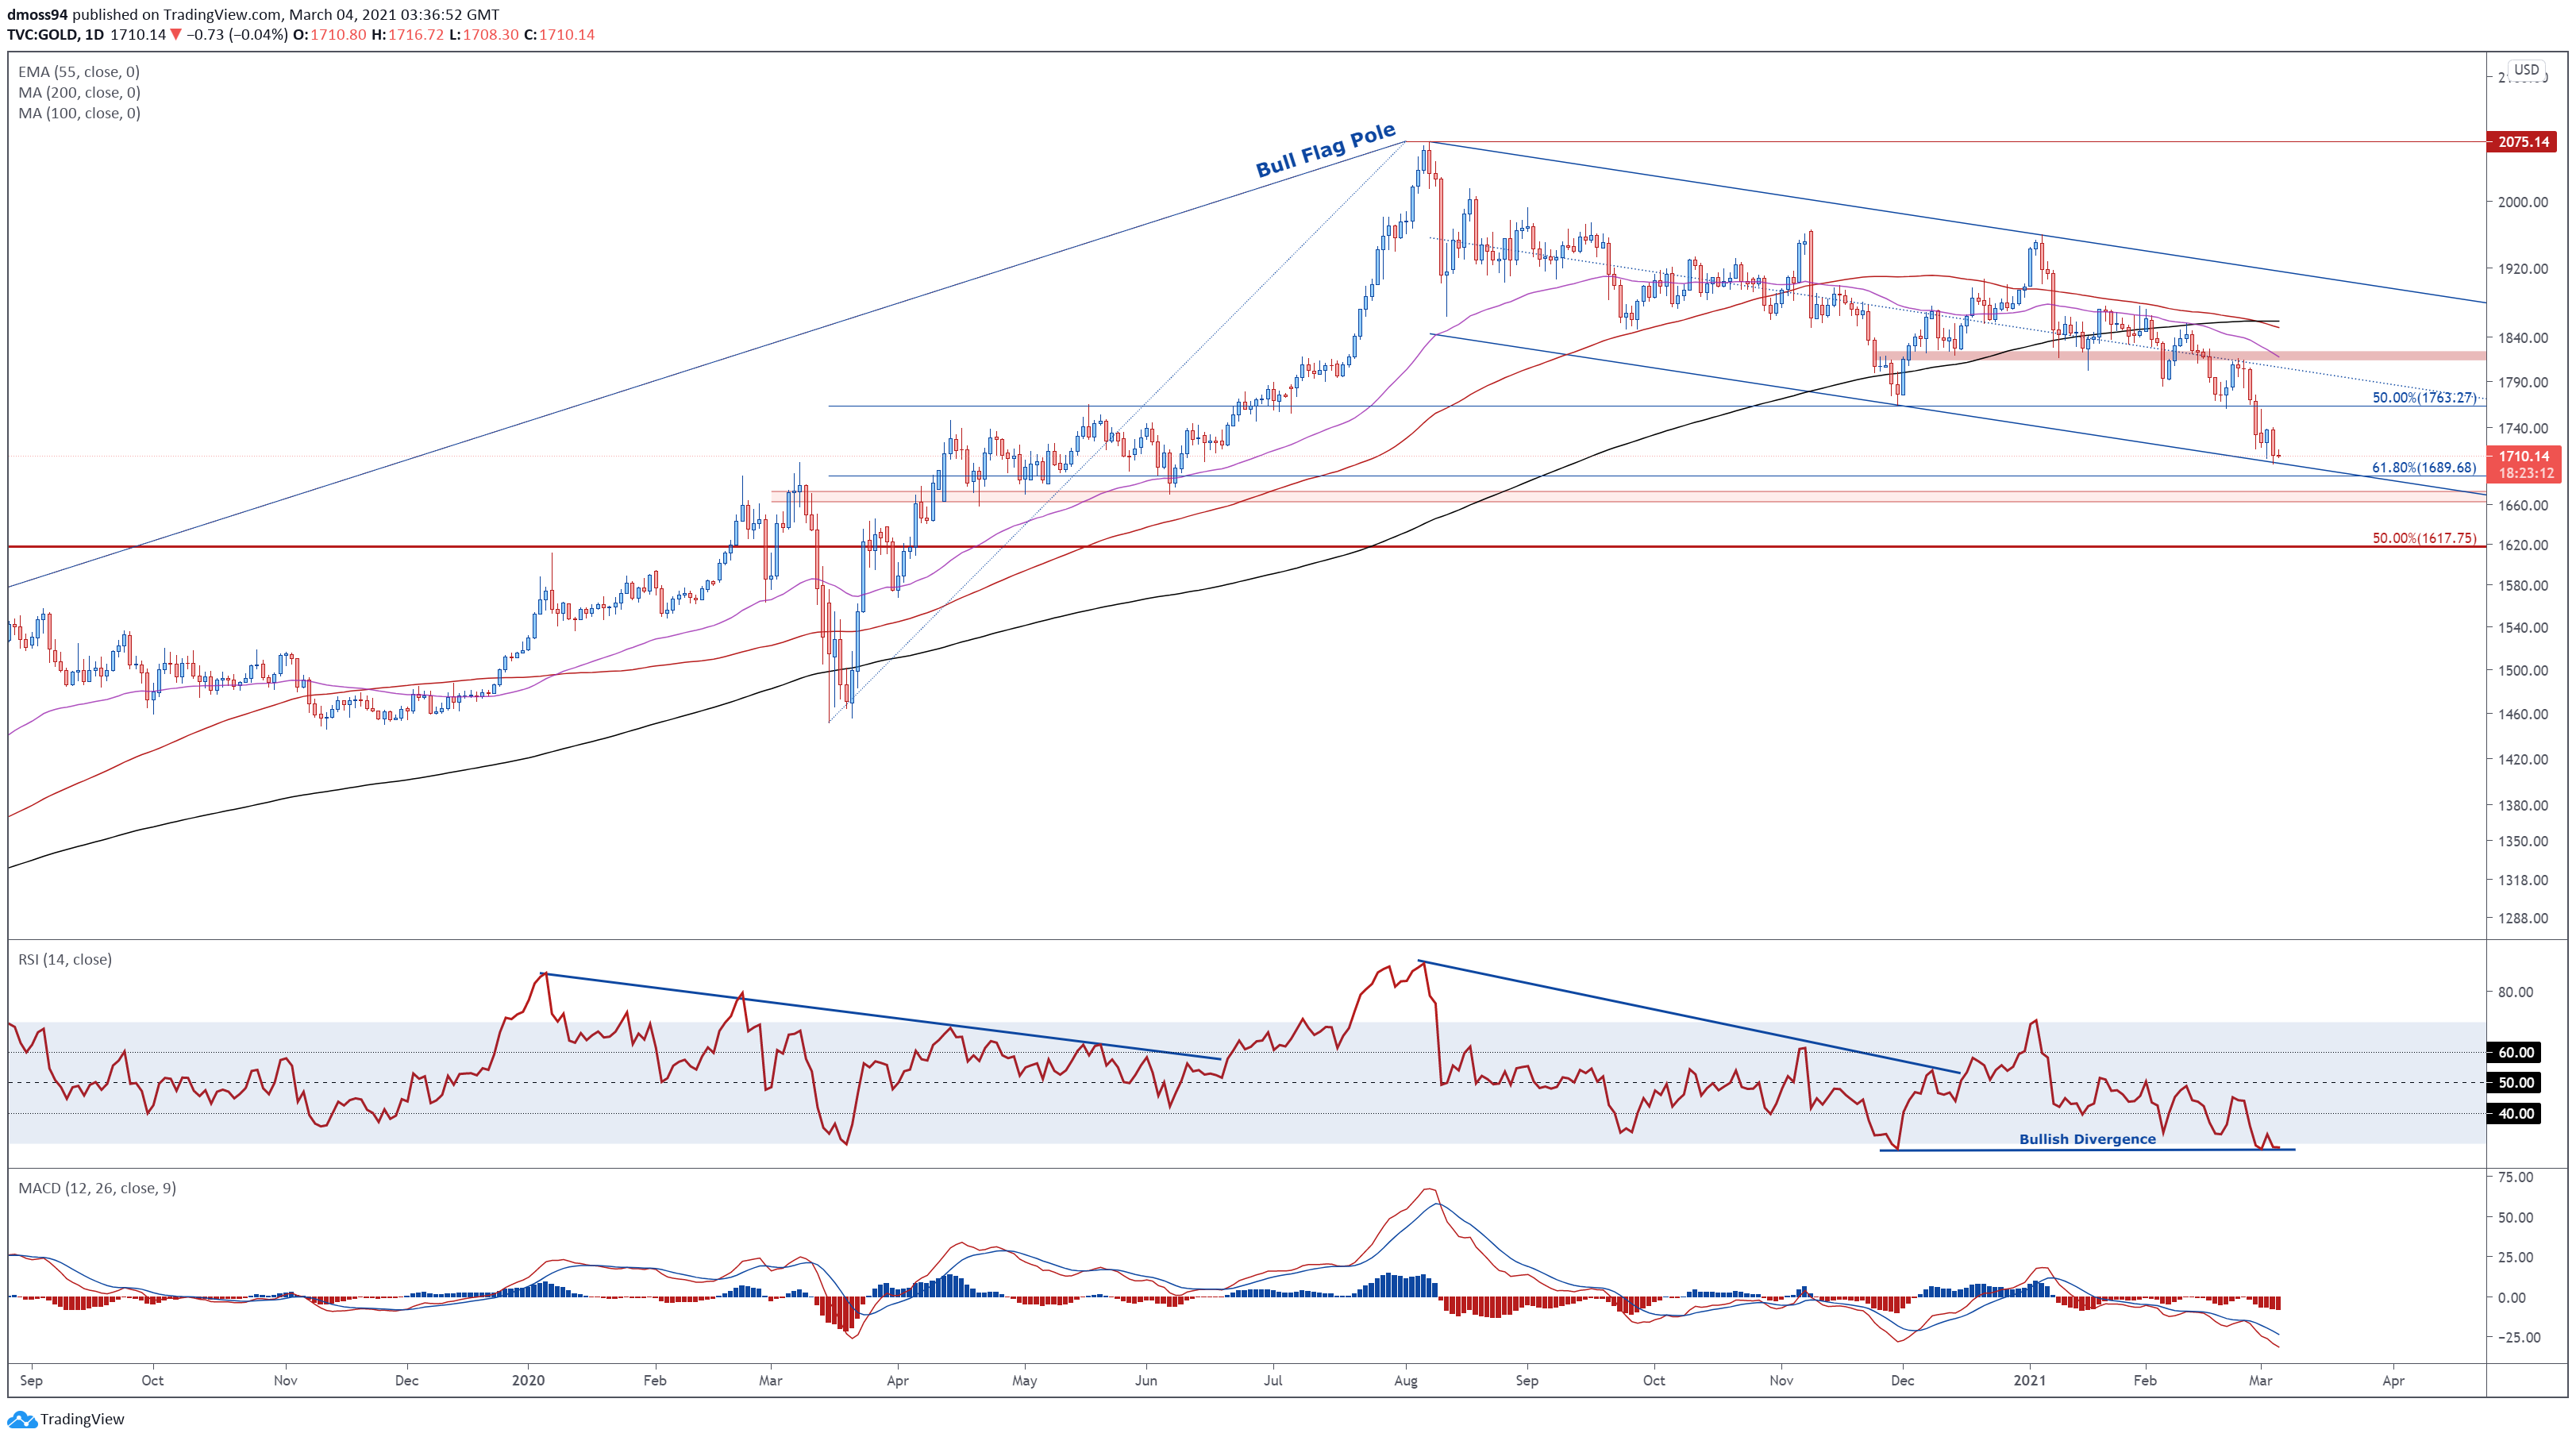
Gold Price Weekly Chart – Bull Flag Pattern Still in Play
Gold prices weekly chart created using Tradingview
Although gold has slipped steadily lower in recent months, the weekly timeframe suggests that this may be more-so a counter-trend correction, then a reversal in the primary uptrend.
Indeed, with price continuing to track above the 50% Fibonacci retracement (1617) of the two year uptrend extending from August 2018 to August 2020 and carving out a Bull Flag continuation pattern, the long-term outlook remains skewed to the upside.
Nevertheless, with the RSI eyeing a push into oversold territory, and the MACD indicator diving below its respective neutral midpoint for the first time since 2018, further losses appear in the offing in the short-term.
A weekly close below flag support and the 1700 mark would probably intensify selling pressure and open the door for price to challenge range support at 1663 – 1673.
On the other hand, if psychological support at 1700 holds firm, a rebound towards the trend-defining 55-EMA (1777) could be on the cards.
Gold Price Daily Chart – Bullish RSI Divergence Hints at Downtrend Exhaustion
Gold price daily chart created using Tradingview
Zooming into a daily chart however, suggests that a short-term relief rally could be in the offing, as Descending Channel support successfully stifles buying pressure.
If psychological support at 1700 remains intact, a bounce back towards the March 3 high (1740) may eventuate. A daily close above that likely opens the door for buyers to probe former support-turned-resistance at the November 2020 Low (1764).
Conversely, a daily close below 1700 would probably carve a path to test the 61.8% Fibonacci (1689), with a convincing push below bringing range support at 1663 – 1673 into focus.
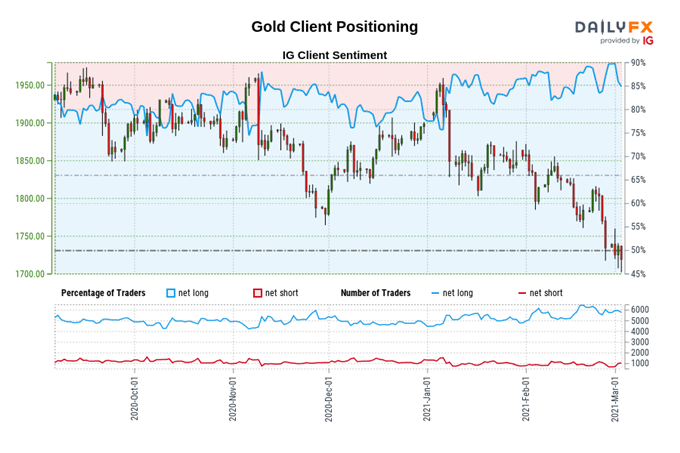
The IG Client Sentiment Report shows 84.79% of traders are net-long with the ratio of traders long to short at 5.57 to 1. The number of traders net-long is 0.84% higher than yesterday and 6.68% higher from last week, while the number of traders net-short is 1.55% higher than yesterday and 5.99% lower from last week.
We typically take a contrarian view to crowd sentiment, and the fact traders are net-long suggests Gold prices may continue to fall.
Positioning is less net-long than yesterday but more net-long from last week. The combination of current sentiment and recent changes gives us a further mixed Gold trading bias.
-- Written by Daniel Moss, Analyst for DailyFX
Follow me on Twitter @DanielGMoss


