


S&P 500, HANG SENG, ASX 200, ASIA-PACIFIC MARKET OUTLOOK:
- Wall Street equities retreated from record highs on Friday as investors weighed the pandemic’s impact
- FOMC meeting and US Q4 GDP data are among the top macro events this week
- Facebook, Microsoft, Apple, Tesla, Amazon earnings will be in focus amid a busy earnings week

Pandemic, US Earnings, FOMC, Asia-Pacific Stocks Weekly Outlook:
Asia-Pacific equities kicked off the week with a positive tone as Wall Street equity futures advanced in early trading hours, erasing last Friday’s losses. Virus concerns and tighter lockdown measures around the globe are back at center-stage as stock marketsappear to have priced in lofty optimism about vaccine rollout, fiscal stimulus, reflation and another seemingly upbeat earnings season. Leaders in the US, EU and UK warned of longer and potentially stricter lockdowns in the wake of mutant Covid-19 straits, which might hinder a near-term economic recovery and favor tech stocks over cyclically-sensitive energy and industrial sectors.
The US Treasury yield curve is little-changed compared to a week ago, with the 10-year rate hovering at around 1.08%. This may point to dwindling hopes for reflation compared to two week ago, when yields surged rapidly alongside the inflation outlook.
This week, traders are eyeing the Federal Reserve’s interest rate decision (expected to be on hold) and an update from Jerome Powell about the central bank’s view of the economic outlook as well as clues about tapering in the FOMC meeting on Wednesday. Although fiscal stimulus may help to cushion some of the pandemic’s economic impact, a still-fragile recovery may warrant a dovish Fed in the near future. Besides, US Q4 GDP(up 4% QoQexpected) and core PCE inflation data are also among the key drivers for USD and the broader markets.Find out more from DailyFX calendar.
Australia’s ASX 200 index opened 0.28% higher, led by consumer staples (+0.78%), information technology (+0.67%) and materials (+0.57%) sectors, whereas energy (-1.15%) and industrials (-0.34%) lagged. The index looks set to challenge a key resistance level at 6,810, buoyed by the approval of Pfizer’s Covid-19 vaccine by Australia’s medical regulator and steady base metal prices.
Hong Kong’s Hang Seng Index (HSI) hit a key resistance level at 30,000 and has since entered a consolidative period. Southbound net flow via the stock connections have fallen for three days in a row, reflecting cooling appetite from mainland investors after a record daily inflow of HK$ 26 billion seen on January 19th. Chinese video-sharing start-up Kuaishou has filed for an IPO in Hong Kong, in which it is expected to raise over US$ 5 billion with strong demand from cornerstone investors.
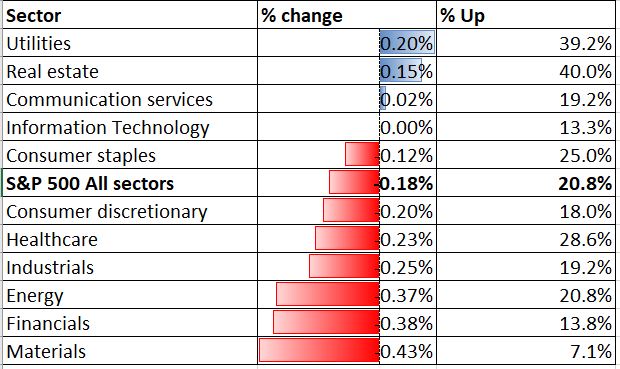
Looking back to Friday, the Dow Jones and S&P 500 indices ended lower as the DXY US Dollar rebounded on rising demand for safety. Nearly 80% of the S&P 500 constituents closed in the red, dragged by materials (-0.43%), financials (-0.38%) and energy (-0.34%) whereas defensive utilities (+0.20%), real estate (+0.15%) and communication services (+0.02%) outperformed.
S&P 500 Sector Performance 22-01-2021
US Q4 earnings have fared well, with 67 out of 82, or 82% of S&P 500 companies beating analysts’ earnings forecasts so far this season. Financial and technology companies outperformed, whereas airlines and energy companies lagged behind due to the lingering impact of the pandemic. Yet, stock markets’ rich valuations and a clouded economic outlook may limit upside potential in the near term, encouraging some liquidating activity to lock in profits.
In the week ahead, around 25% of S&P 500 companies will release their results, including GE, Johnson & Johnson, 3M, Microsoft, Boeing, AT&T, Facebook, Apple, Tesla, Visa and Amazon. Read more on my earnings outlook report.

S&P 500 Index Technical Analysis:
Technically, the S&P 500 index has pulled back slightly from the ceiling of the “Ascending Channel” as highlighted in the chart below. The bull trend remains intact and is well-supported by its 20-Day Simple Moving Average (SMA) line. Support and resistance levels can be found at 3,804 (76.4% Fibonacci extension) and 3,893 (100% Fibonacci extension) respectively.
S&P 500 Index – Daily Chart

ASX 200 Index Technical Analysis:
The ASX 200 index is attempting to breach a key resistance level at 6,810 (200% Fibonacci extension) after penetrating the ceiling of a range-bound zone, as highlighted in green. Breaking 6,810 may open the door for further upside potential with an eye on 6,900. Widening Bollinger Band width and a bullish MACD crossover hint at strong upward momentum. An immediate support level can be found at 6,718 – the 20-Day SMA.
ASX 200 Index – Daily Chart

Hang Seng Index Technical Analysis:
The Hang Seng index is riding a strong trend with an attempt to breach the 127.2% Fibonacci extension level at 29,870. Breaching this level may open the door for further upside potential with an eye on 30,930 – the 161.8% Fibonacci extension. The MACD indicator has shown sign of weakness however, which may suggest that the index is temporarily overbought and due for a correction.
Hang Seng Index – Daily Chart


S&P 500 Earnings Calendar 21-22nd January 2021
| Name | Date | Actual | Estimate | Surprise |
|---|---|---|---|---|
| TAL Education Group | 21/1/2021 | 0.02 | 0.066 | (69.70) |
| M&T Bank Corp | 21/1/2021 | 3.54 | 3.012 | 17.50 |
| Truist Financial Corp | 21/1/2021 | 1.18 | 0.951 | 24.10 |
| KeyCorp | 21/1/2021 | 0.57 | 0.43 | 32.60 |
| Fifth Third Bancorp | 21/1/2021 | 0.87 | 0.688 | 26.50 |
| Travelers Cos Inc/The | 21/1/2021 | 4.91 | 3.198 | 53.50 |
| Baker Hughes Co | 21/1/2021 | (0.07) | 0.172 | (140.70) |
| Northern Trust Corp | 21/1/2021 | 1.49 | 1.488 | 0.20 |
| FuelCell Energy Inc | 21/1/2021 | (0.07) | (0.023) | (201.00) |
| Union Pacific Corp | 21/1/2021 | 2.36 | 2.244 | 5.20 |
| Intel Corp | 21/1/2021 | 1.42 | 1.111 | 27.80 |
| CSX Corp | 21/1/2021 | 0.99 | 1.005 | (1.50) |
| Intuitive Surgical Inc | 21/1/2021 | 3.58 | 3.154 | 13.50 |
| Seagate Technology PLC | 21/1/2021 | 1.29 | 1.134 | 13.80 |
| International Business Machine | 21/1/2021 | 2.07 | 1.791 | 15.60 |
| PPG Industries Inc | 21/1/2021 | 1.59 | 1.569 | 1.30 |
| SVB Financial Group | 21/1/2021 | 7.40 | 3.873 | 91.10 |
| People's United Financial Inc | 21/1/2021 | 0.35 | 0.318 | 10.10 |
| Boston Private Financial Holdi | 21/1/2021 | 0.30 | 0.17 | 76.50 |
| New Oriental Education & Techn | 22/1/2021 | 0.43 | 0.341 | 26.10 |
| Regions Financial Corp | 22/1/2021 | 0.61 | 0.419 | 45.60 |
| Schlumberger NV | 22/1/2021 | 0.22 | 0.175 | 25.70 |
| Huntington Bancshares Inc/OH | 22/1/2021 | 0.27 | 0.293 | (7.80) |
| Ally Financial Inc | 22/1/2021 | 1.60 | 1.066 | 50.10 |
| Kansas City Southern | 22/1/2021 | 1.89 | 1.925 | (1.80) |
| Reliance Industries Ltd | 22/1/2021 | 20.33 | 18.176 | 11.90 |
| Reliance Industries Ltd | 22/1/2021 | 20.33 | 18.176 | 11.90 |
Source: Bloomberg
--- Written by Margaret Yang, Strategist for DailyFX.com
To contact Margaret, use the Comments section below or @margaretyjy on Twitter


