


Gold (XAU/USD) Analysis, Price and Chart
- Moving average resistance remains firm.
- Client sentiment suggests gold may move higher.
The price of gold is stuck in a small range in early turnover as traders ready themselves for a busy week of potentially market-moving data releases and events. Tomorrow sees the release of the closely watched consumer confidence number for January, Wednesday sees durable goods for December and the latest FOMC meeting and policy decision, Thursday the first look at Q4 GDP while on Friday, the Fed’s favoured reading of inflation, core PCE. All these releases and the FOMC meeting have the potential to move the US dollar in the short-term and by association, the price of gold as well. The US dollar basket is currently trading a fraction higher at 90.23, just below the middle of the current 90.00 to 91.00 trading range.
For all market-moving data releases and events see the DailyFX Calendar.
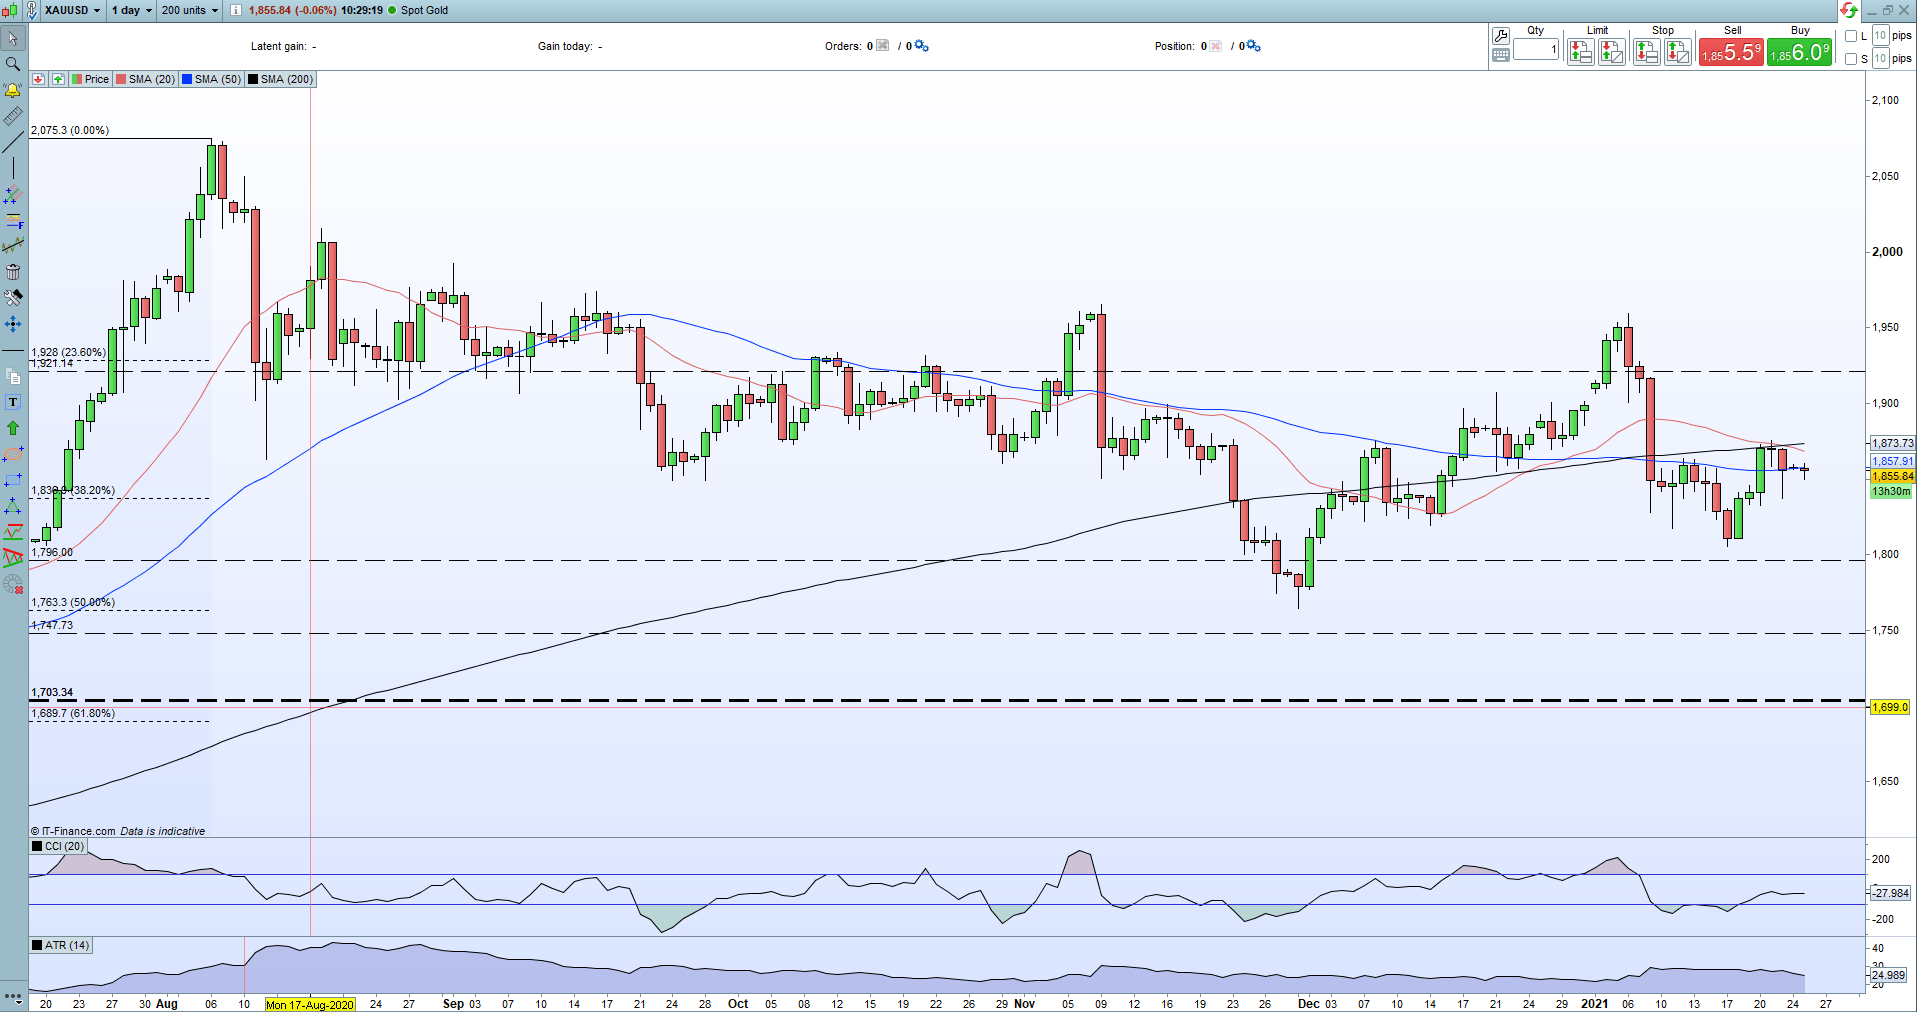
The daily chart shows gold being propped up by the 38.2% Fibonacci retracement level at $1,837/oz. while a cluster of moving averages is stymying further upside progress. The precious metal has broken above the 50-day sma but still has the 20- and 200-day smas and three recent prior highs blocking the way past $1,875/oz. This level should hold in the short-term although further US dollar weakness will see this cluster of resistance come under pressure.
Moving Averages (MA) Explained for Traders

Gold Daily Price Chart (July 2020 – January 25, 2021)
| Change in | Longs | Shorts | OI |
| Daily | 1% | -3% | -1% |
| Weekly | 2% | -8% | -2% |
IG retail trader data show 81.74% of traders are net-long with the ratio of traders long to short at 4.48 to 1. We typically take a contrarian view to crowd sentiment, and the fact traders are net-long suggests Gold prices may continue to fall.Yet traders are less net-long than yesterday and compared with last week. Recent changes in sentiment warn that the current Gold price trend may soon reverse higher despite the fact traders remain net-long.
What is Market Sentiment and How Does it Work?
What is your view on Gold – are you bullish or bearish?? You can let us know via the form at the end of this piece or you can contact the author via Twitter @nickcawley1.


