


S&P 500, HANG SENG, NIKKEI 225, ASIA-PACIFIC MARKET OUTLOOK:
- The S&P 500 index closed marginally higher as tech gained, but two thirds of the stocks fell
- Asia-Pacific indices look set to pull back slightly from their recent highs
- Southbound inflow in HK via stock connections fell for a second day, risking a pullback in the HSI

S&P 500, Hang Seng, Earnings, Asia-Pacific Stocks Outlook:
Asia-Pacific stocks look set to open broadly lower after Wall Street saw a mixed trading session. The S&P 500 index edged marginally higher, led by heavy-weight information technology (+1.32%), consumer discretionary (+0.55%) and communication services (+0.26%), while two thirds of its constituents finished lower. Investors are perhaps looking for fresh catalysts to support Wall Street’s record-breaking rally when stock market valuations are close to two-decade highs.
US earnings continued to deliver positive surprises, with 15 out of 19 S&P 500 companies beating market forecasts last night (table at the end). Intel’s share price fell 4.5% in aftermarket trade despite posting a record revenue and higher-than-expected EPS. So far in the earnings season, more than 85% of the blue chips have smashed analysts’ forecasts. Read more on my earnings outlook report.
S&P 500 Sector Performance 21-01-2021
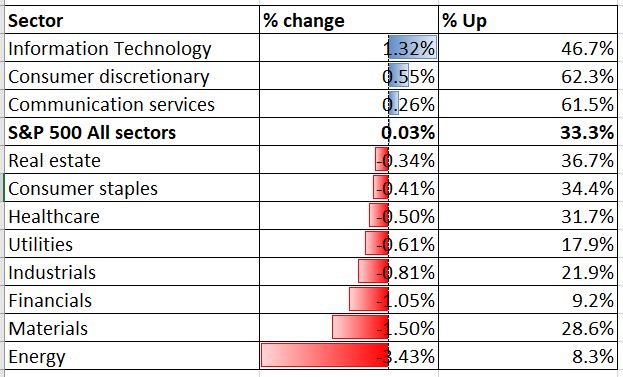
Source: Bloomberg, DailyFX
A mixed US session may set a sour tone for Asia-Pacific markets, with equity futures pointing to a lower start across Japan, Australia, Hong Kong, Malaysia and India on Friday morning. Japan’s Nikkei 225 stock market benchmark looks set to open mildly lower after gaining 0.82% on Thursday.
The Hang Seng Index (HSI) is facing some selling pressure as the index attempts to challenge a psychological resistance level at 30,000. The HSI registered a whopping 15% gain over the last month, propelled by substantial amount of southbound inflow via the Hong Kong-Shanghai and Hong Kong-Shenzhen stock connections. It is worth noting that daily southbound inflowhas fallentwo days in a row to HK$ 16,263 million from a record high of 26,592 million seen on January 19th, reflecting cooling appetite from mainland investors for Hong Kong stocks. Total southbound flows contributed to around 30% HKEX's daily turnover recently.
Hang Seng Index vs. Daily Southbound Net Flow – 12 Months

Source: Bloomberg, DailyFX
Australia’s ASX 200 Index opened 0.11% lower amid a defensive trading session. Healthcare (+1.99%), consumer discretionary (+1.25%) and consumer staples (+0.52%) were leading while energy (-2.06%) and information technology (-1.71%) were lagging.
On the macro front, UK retail sales and a string of Markit Manufacturing PMIs across the EU and US will be closely eyed on Friday. Find out more from DailyFX calendar.

S&P 500 Index Technical Analysis:
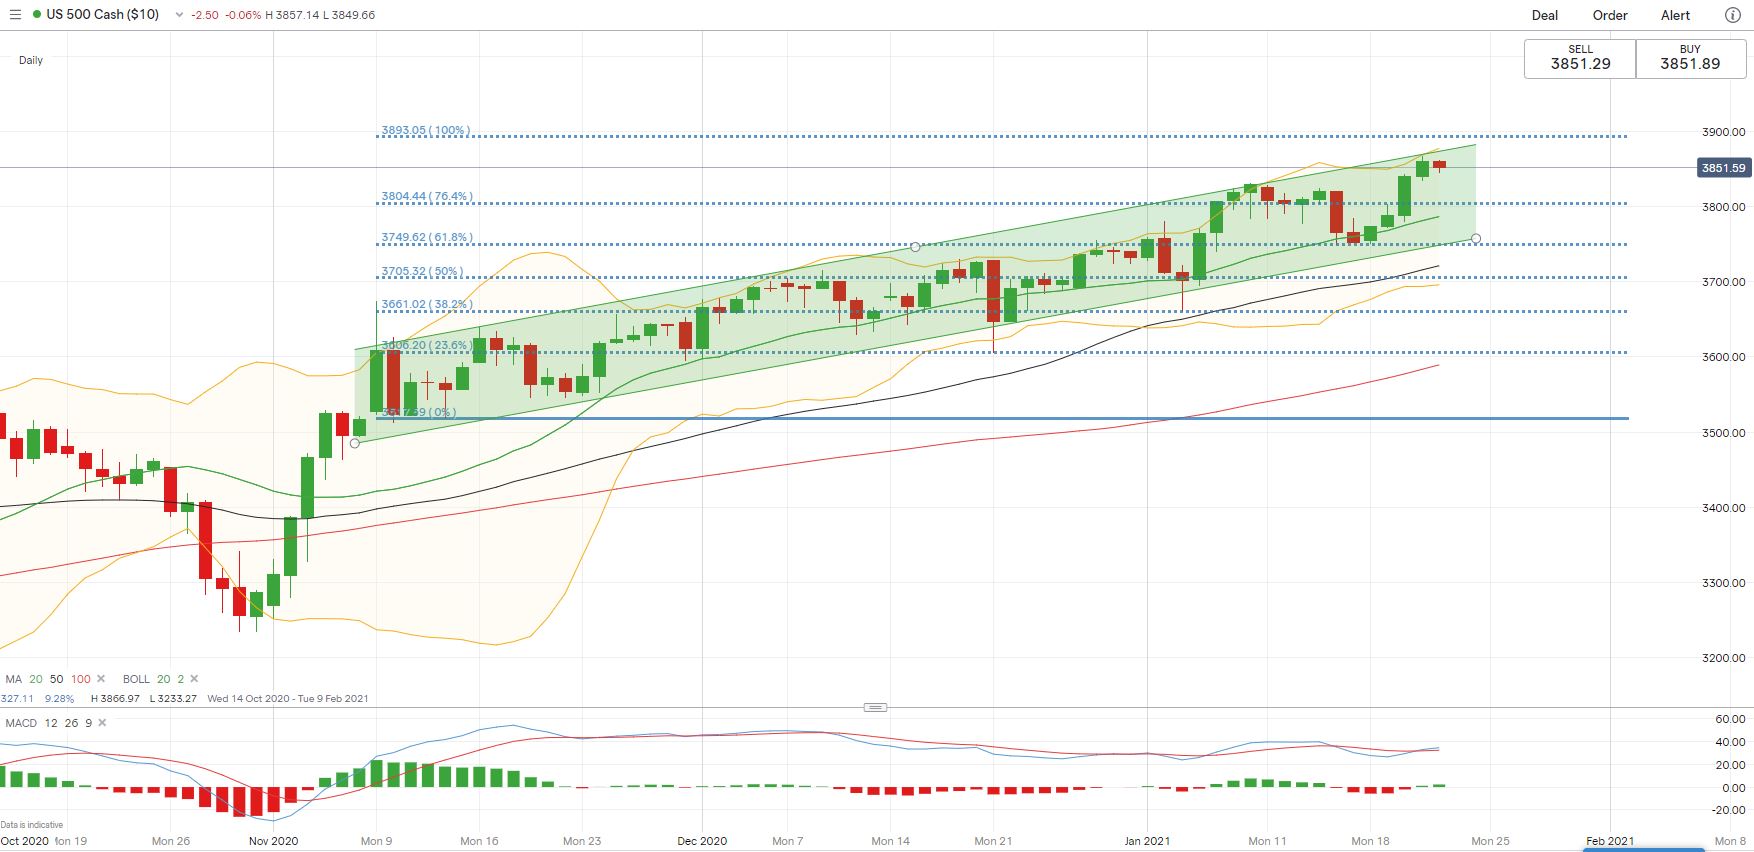
Technically, the S&P 500 index extended its upward trajectory within an “Ascending Channel” as highlighted in the chart below. The bull trend is well-supported by its 20-Day Simple Moving Average (SMA) line, albeit the upper ceiling of the channel may serve as an immediate resistance. Support and resistance levels can be found at 3,893 (100% Fibonacci extension) and 3,804 (76.4% Fibonacci extension) respectively.
S&P 500 Index – Daily Chart
Hang Seng Index Technical Analysis:
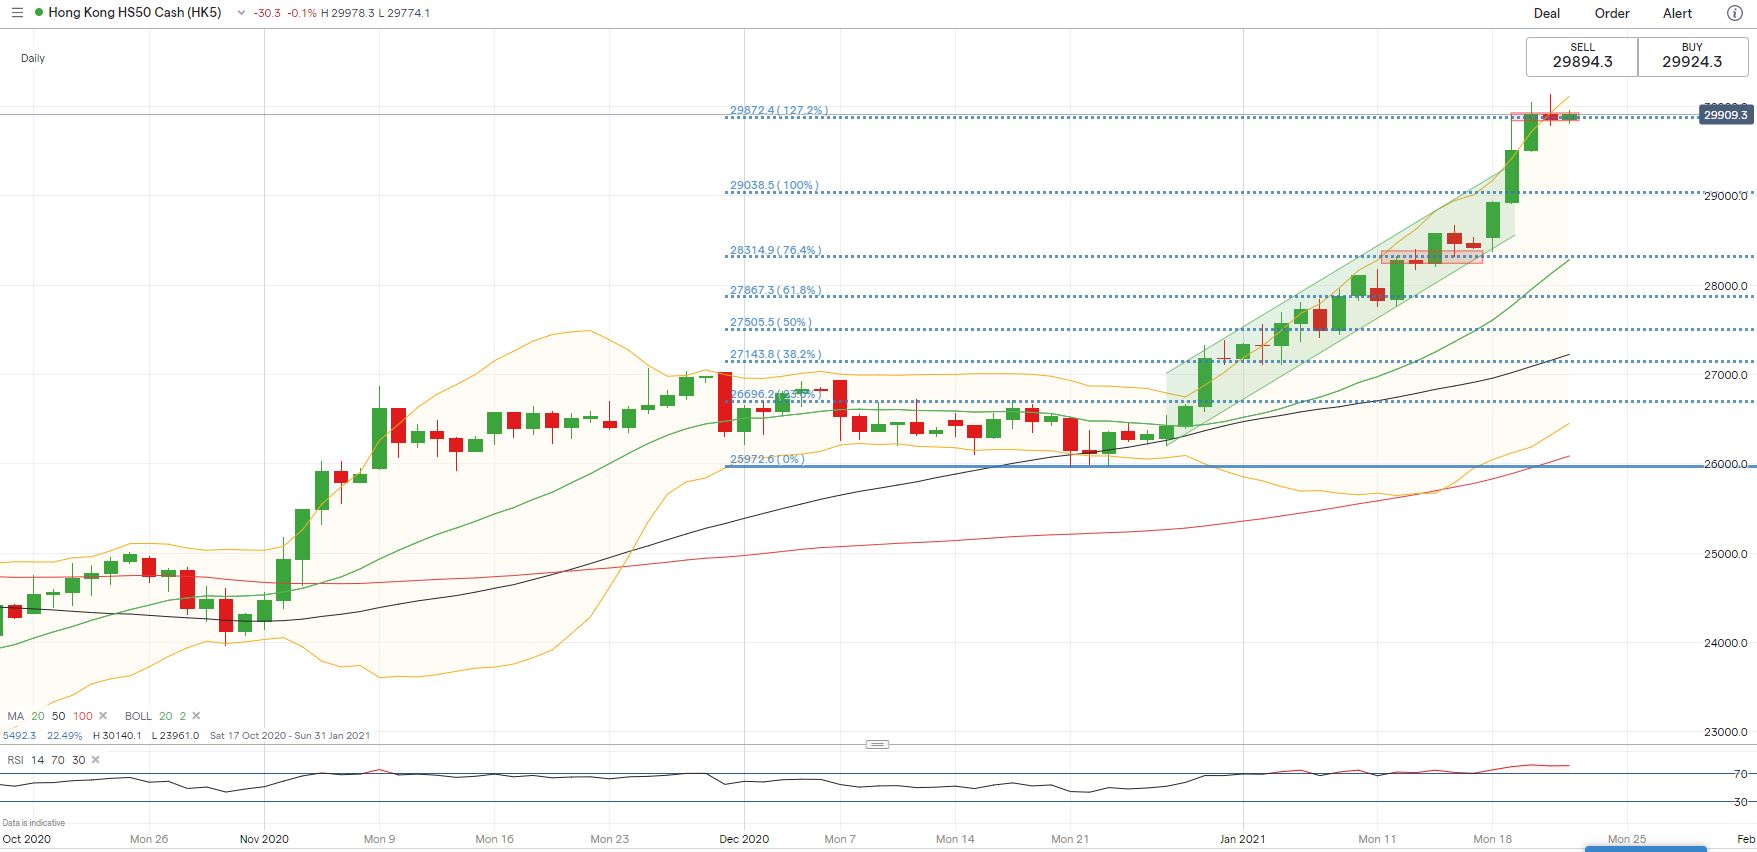
The Hang Seng Index is riding a strong trend and is about to challenge a psychological resistance level at 30,000. Breaching it may open the door for further upside potential with an eye on 30,933 – the 161.8% Fibonacci extension. A failed attempt, however, may lead to a technical pullback to test an immediate support level at 29,038 – the 100% Fibonacci extension. The RSI indicator stretches beyond the overbought threshold of 70, reflecting strong upward momentum but also warns about a technical correction.
Hang Seng Index – Daily Chart
Nikkei 225 Index Technical Analysis:
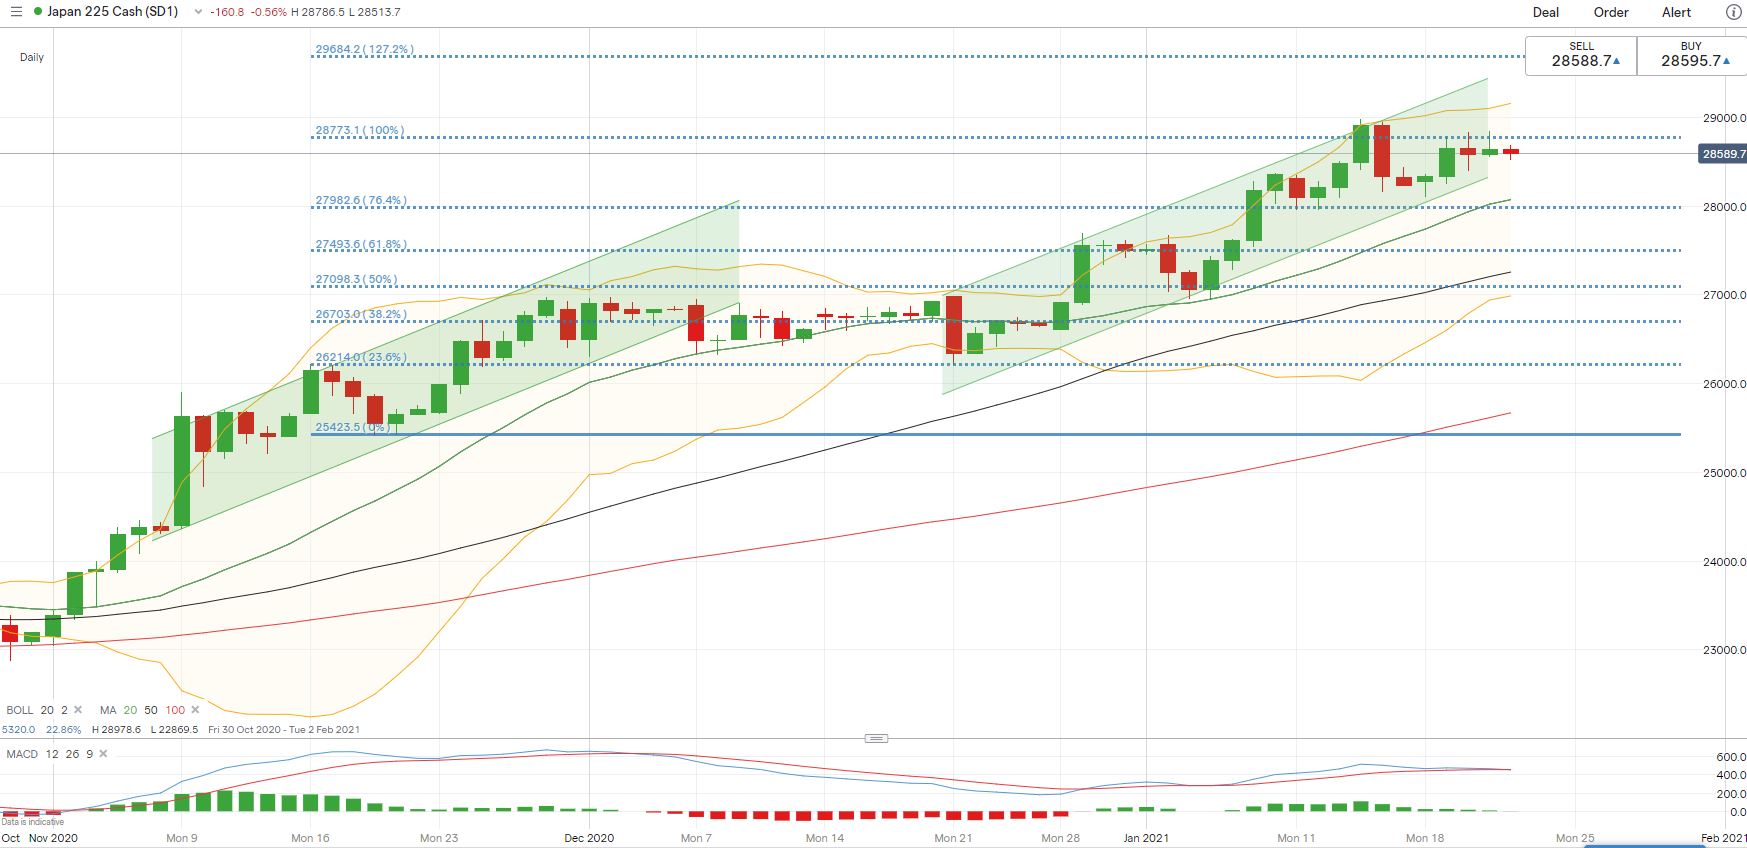
The Nikkei 225 index hit the 100% Fibonacci extension level of 28,770 and has retraced slightly since. The overall trend remains bullish as highlighted in the two “Ascending Channels” below, although a period of consolidation may be seen before the index attempts higher highs. A bearish MACD crossover may hint at short-term pressure. Immediate support and resistance levels can be found at 27,800 (76.4% Fibonacci extension) and 28,770 (100% Fibonacci extension) respectively.
Nikkei 225 Index – Daily Chart

S&P 500 Earnings Calendar 21-22nd January 2021
| Name | Date | Period | Actual | Estimate | Surprise |
|---|---|---|---|---|---|
| TAL Education Group | 21/1/2021 | Q3 21 | 0.02 | 0.066 | (69.70) |
| M&T Bank Corp | 21/1/2021 | Q4 20 | 3.54 | 3.012 | 17.50 |
| Truist Financial Corp | 21/1/2021 | Q4 20 | 1.18 | 0.951 | 24.10 |
| KeyCorp | 21/1/2021 | Q4 20 | 0.57 | 0.43 | 32.60 |
| Fifth Third Bancorp | 21/1/2021 | Q4 20 | 0.87 | 0.688 | 26.50 |
| Travelers Cos Inc/The | 21/1/2021 | Q4 20 | 4.91 | 3.198 | 53.50 |
| Baker Hughes Co | 21/1/2021 | Q4 20 | (0.07) | 0.172 | (140.70) |
| Northern Trust Corp | 21/1/2021 | Q4 20 | 1.49 | 1.488 | 0.20 |
| FuelCell Energy Inc | 21/1/2021 | Q4 20 | (0.07) | (0.023) | (201.00) |
| Union Pacific Corp | 21/1/2021 | Q4 20 | 2.36 | 2.244 | 5.20 |
| Intel Corp | 21/1/2021 | Q4 20 | 1.42 | 1.111 | 27.80 |
| CSX Corp | 21/1/2021 | Q4 20 | 0.99 | 1.005 | (1.50) |
| Intuitive Surgical Inc | 21/1/2021 | Q4 20 | 3.58 | 3.154 | 13.50 |
| Seagate Technology PLC | 21/1/2021 | Q2 21 | 1.29 | 1.134 | 13.80 |
| PPG Industries Inc | 21/1/2021 | Q4 20 | 1.59 | 1.569 | 1.30 |
| International Business Machine | 21/1/2021 | Q4 20 | 2.07 | 1.791 | 15.60 |
| SVB Financial Group | 21/1/2021 | Q4 20 | 7.40 | 3.873 | 91.10 |
| People's United Financial Inc | 21/1/2021 | Q4 20 | 0.35 | 0.318 | 10.10 |
| Boston Private Financial Holdi | 21/1/2021 | Q4 20 | 0.30 | 0.17 | 76.50 |
| Regions Financial Corp | 22/1/2021 | Q4 20 | 0.419 | ||
| Kansas City Southern | 22/1/2021 | Q4 20 | 1.925 | ||
| Huntington Bancshares Inc/OH | 22/1/2021 | Q4 20 | 0.293 | ||
| New Oriental Education & Techn | 22/1/2021 | Q2 21 | 0.341 | ||
| Reliance Industries Ltd | 22/1/2021 | Q3 21 | 18.176 | ||
| Reliance Industries Ltd | 22/1/2021 | Q3 21 | 18.176 | ||
| Schlumberger NV | 22/1/2021 | Q4 20 | 0.175 | ||
| Ally Financial Inc | 22/1/2021 | Q4 20 | 1.066 |
Source: Bloomberg
--- Written by Margaret Yang, Strategist for DailyFX.com
To contact Margaret, use the Comments section below or @margaretyjy on Twitter


