


S&P 500, HANG SENG, ASX 200 INDEX OUTLOOK:
- An uninspired US trading session offers little clue for the Hang Seng and ASX 200 indexes
- China import and export growth data may set the tone for Asia-Pacific and European trading
- Treasury yields retreated for a second day; US Dollar rebounded. US earnings season kicks off

S&P 500, China Trade Balance, ASX 200, Asia-Pacific at Open:
US equity indices hovered near their record highs overnight, underpinned by stimulus hopes, a gradual rollout of Covid vaccines and falling Treasury yields that help alleviate pressure on risk assets in general. Trading was tilted to the defensive side, with utilities (+1.94%), real estate (+1.39%) and information technology (0.65%) leading the gains. Meanwhile, cyclical-linked materials (-1.06%), industrials (-0.86%) and energy (-0.79%) trailed.
Defensive US trading patterns may set a cautious tone for Asia-Pacific open. A stronger US Dollar appeared to have exerted more downward pressure on commodities than equities, pulling crude oil and gold prices lower and may undermine emerging markets currencies. WTI crude oil prices retreated from an 11-month highs as profit-taking kicked in.
S&P 500 Sector Performance 14-01-2021

Source: Bloomberg, DailyFX
Share prices of Alibaba ADR (+4.3%) and Tencent ADR (+2.91%) advanced after US regulators decided not to put them into a blacklist on alleged ties to China’s military, allowing US investors to continue to invest in these companies. The news may underpin the performance of the Hang Seng Index as Alibaba and Tencent accounts for 4.0% and 9.6% of the index’s weight respectively.
On the macro front, investors are eyeing Chinese trade balance data scheduled to be released at 3:00 GMT. Markets foresee export growth to have slowed down to 15.0% YoY from November’s print of 21.1%. Chinese exports registered strong growth in the second half of 2020, driven by robust overseas demand and Covid-linked interruptions in manufacturing activity elsewhere in the world. Chinese import growth is expected to edge up slightly to 5.7% YoY from 4.5% in the previous month. Find out more from DailyFX calendar.
Chinese figures may set the tone for Asia-Pacific and European markets, in particularly Australia’s ASX 200 index and the Australian Dollar. Stronger-than-expected export growth may hint at rising demand for base materials and energy products that tend to buoy the Australian Dollar. The ASX 200 Index is trading mildly lower at the open, led by information technology (+2.65%) and real estate (+0.95%) sectors. Materials (-1.28%), consumer discretionary (-1.08%) and energy (-1.31%) sectors are lagging.
China Export Trade YoY Forecast – Dec 2020

Source: Bloomberg, DailyFX
China Import Trade YoY Forecast – Dec 2020
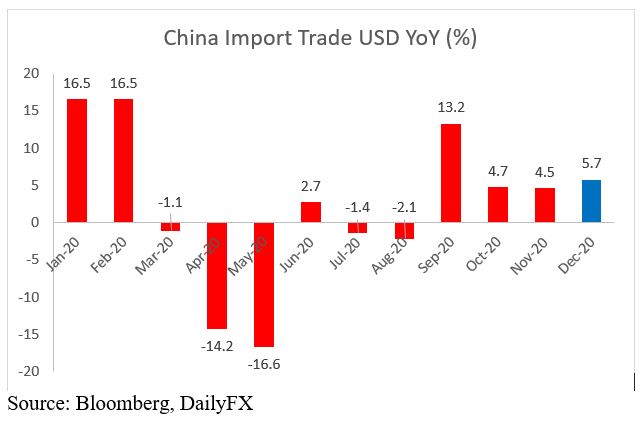
Source: Bloomberg, DailyFX
US Q4 earnings season is kicking off this week, with JP Morgan, Citigroup and Wells Fargo due to release results on Friday. Analysts and companies have been more optimistic about the fourth quarter earnings outlook, with 56 S&P 500 companies issuing positive EPS guidance compared to 29 that issued negative ones. According to Factset, the estimated earnings decline for the S&P 500 index for Q4 2020 is -8.8%, marking the third-largest decline since Q3 2009.
S&P 500 Earnings Calendar – Week ending 15th Jan 2021
| Name | Date | Period | Actual | Estimate | Surprise |
|---|---|---|---|---|---|
| IHS Markit Ltd | 13/1/2021 | Q4 20 | 0.72 | 0.666 | 8.10 |
| BlackRock Inc | 14/1/2021 | Q4 20 | 9.192 | ||
| First Republic Bank/CA | 14/1/2021 | Q4 20 | 1.512 | ||
| Delta Air Lines Inc | 14/1/2021 | Q4 20 | (2.498) | ||
| PNC Financial Services Group I | 15/1/2021 | Q4 20 | 2.607 | ||
| JPMorgan Chase & Co | 15/1/2021 | Q4 20 | 2.623 | ||
| Citigroup Inc | 15/1/2021 | Q4 20 | 1.331 | ||
| Wells Fargo & Co | 15/1/2021 | Q4 20 | 0.60 |
Source: Bloomberg
S&P 500 Index Technical Analysis
The S&P 500 indexcontinued its upward trajectory within the “Ascending Channel” formed since early November. The overall trend remains bullish-biased and well-supported by the 20-Day Simple Moving Average (SMA) line. Immediate support and resistance levels can be found at 3,804 (76.4% Fibonacci extension) and 3,893 (100% Fibonacci extension) respectively.
S&P 500 Index – Daily Chart

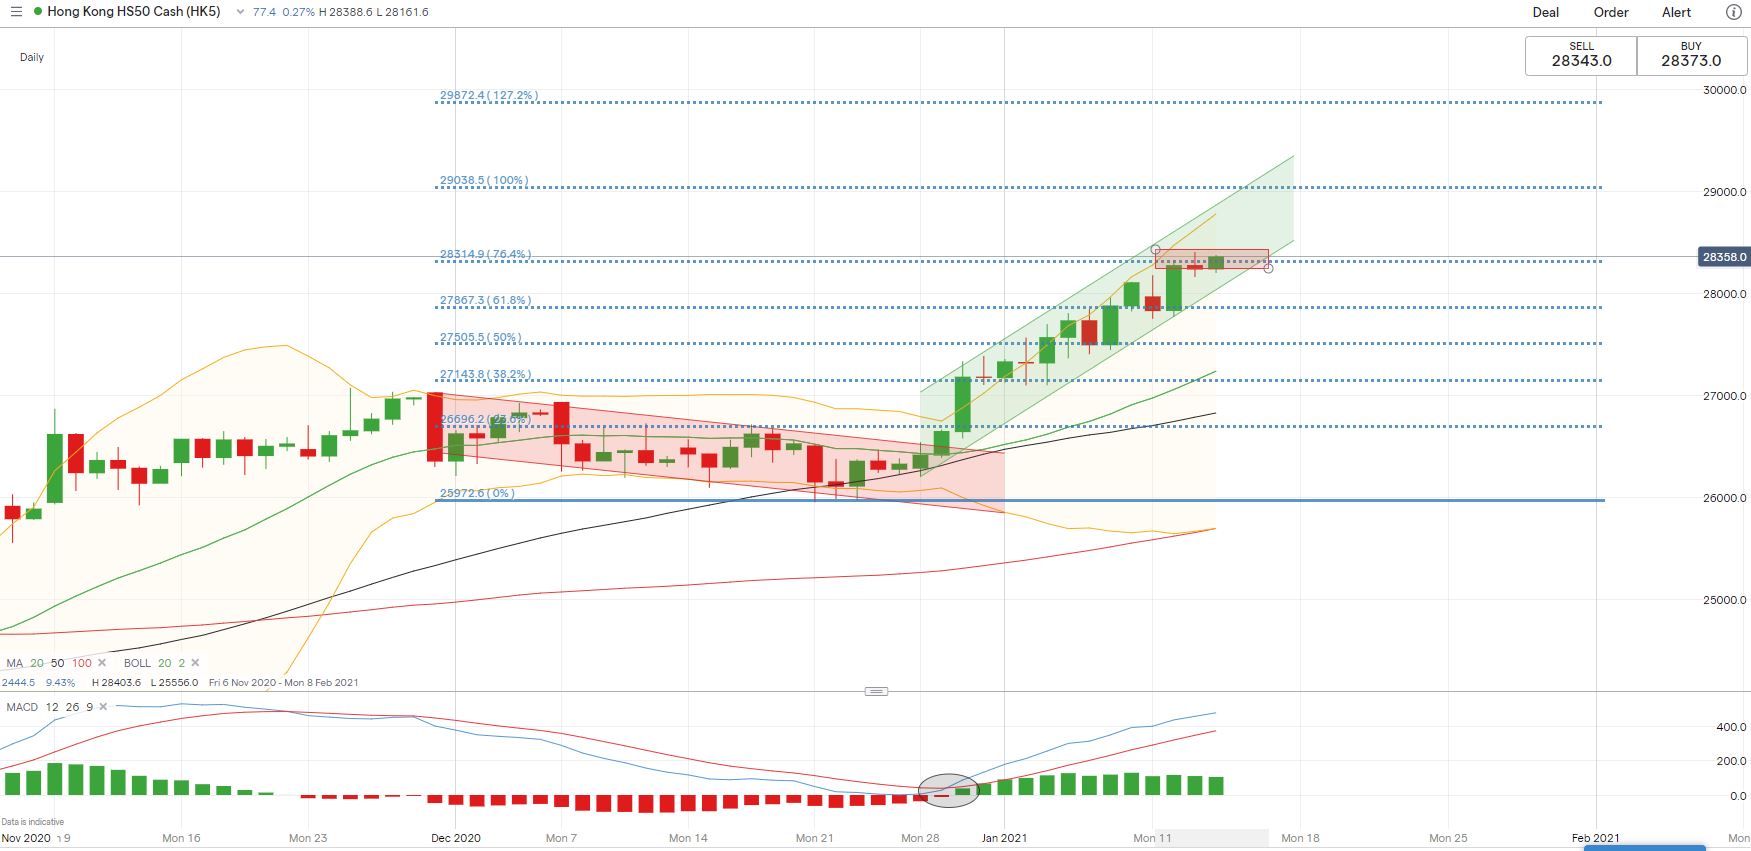
Hang Seng Index Technical Analysis:
The Hang Seng index is riding a strong trend and is about to challenge a 76.4% Fibonacci extension level at 28,315. Breaching this level may open the room for further upside potential with an eye on 29,040 – the 100% Fibonacci extension. The MACD indicator is trending up alongside prices, reflecting strong bullish momentum.
Hang Seng Index – Daily Chart
ASX 200 Index Technical Analysis:
The ASX 200 index remains within its “Ascending Channel” as highlighted on the chart below, but upward momentum appears to be faltering as the MACD indicator trends lower. An immediate support level can be found at 6,630 – the 161.8% Fibonacci extension level. A firm break down below this level may open the door for further losses. An immediate resistance level can be found at 6,760 – the upper Bollinger band.
ASX 200 Index – Daily Chart


--- Written by Margaret Yang, Strategist for DailyFX.com
To contact Margaret, use the Comments section below or @margaretyjy on Twitter


