


- Bitcoin sell-off a threat to major cryptocurrencies?
- RSI exits overbought territory
- Trendline support holds bears at bay
Bitcoin prices have rebounded slightly, following a sell-off from Friday’s high, where BTC/USD broke above $40,000, before facing a wall of resistance formed by the key psychological level of $42,000. The three day sell-off resulted in a $10,000 depreciation in the digital currency, raising concern that the Bitcoin ‘bubble’ had officially burst. However, the pullback in prices is no comparison to the massive 949% surge from March 2020 low.

Meanwhile, fundamental factors appear to be influencing price action, with Bitcoin recently portraying the same characteristics as Gold, Silver and other safe-haven assets, which benefit from US Dollar weakness. On the regulatory front, additional drivers of price action have been attributed to warnings from both the New Zealand and UK regulators (FMA & FCA respectively) who have cautioned individuals against trading Bitcoin and other digital currencies.
Bitcoin (BTC/USD) Technical Analysis
After plunging approximately 11% in yesterday’s trading session, Bitcoin bulls were able to bounce off trendline support, pushing price action to a zone of resistance, formed by the 23.6% Fibonacci retracement (between November 2020 low and January 2021 high) at $35,866. The 20-period Moving Average (MA) continues to provide additional support, while the Relative Strength Index (RSI) now rests beneath 70, indicating that BTC/USD may be exiting overbought territory.

Bitcoin (BTC/USD) Daily Chart
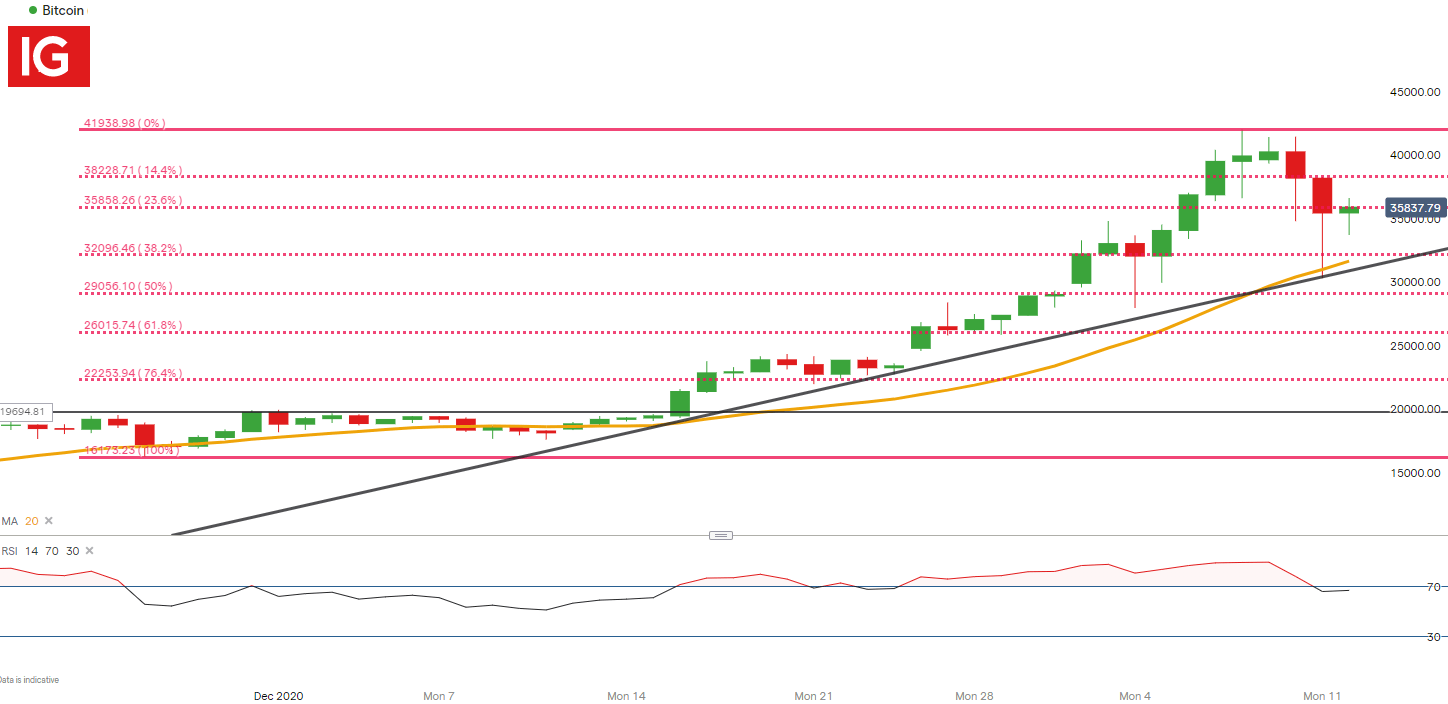
Chart prepared by Tammy Da Costa, IG
If bulls are able to break above current resistance, a bullish continuation could be probable, with the potential retest of $40,000.
However, if bears are able to drive prices lower, a break below current support, could bring the 50% Fibonacci retracement into focus at $29,023
Bitcoin (BTC/USD) Sentiment
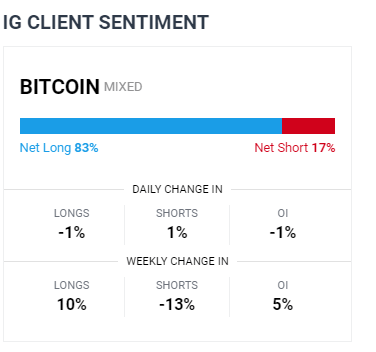

At the time of writing, retail trader data shows 84.05% of traders are net-long with the ratio of traders long to short at 5.27 to 1. The number of traders net-long is 7.02% higher than yesterday and 16.14% higher from last week, while the number of traders net-short is 15.08% lower than yesterday and 20.86% lower from last week.
We typically take a contrarian view to crowd sentiment, and the fact traders are net-long suggests Bitcoin prices may continue to fall.
Traders are further net-long than yesterday and last week, and the combination of current sentiment and recent changes gives us a stronger Bitcoin-bearish contrarian trading bias.
--- Written by Tammy Da Costa, Market Writer for DailyFX.com
Contact and follow Tammy on Twitter: @Tams707


