


NASDAQ 100, NIKKEI 225, HANG SENG INDEX OUTLOOK:
- APAC stocks retreated, tech shares dragged the Wall Street benchmarks lower
- US stimulus talks faced deadlock over a business liability shield and aid to state and local governments
- The US Dollar strengthened, risking further pullback in risk assets and metals. ECB meeting in focus
Tech Pullback, US Relief Package, ECB Interest Rate Decision, Asia-Pacific at Open:
The Nasdaq 100 index tumbled 2.1% overnight as stalling US stimulus talks and a seemingly smooth rollout of coronavirus vaccines encouraged profit-taking activity in the tech sector. The Dow Jones and S&P 500 index registered relatively small losses, both falling from their record highs. The negotiation between Republicans and Democrats over the fiscal bill faced deadlock over a business liability shield and aid to state and local governments. Traders are perhaps taking this opportunity to unwind some of the positions built on stimulus hopes earlier this month.
This came along with rapid climbing US Covid-19 cases, which hit 220k on December 8th with total infections surpassing 15.2 million. Previously, California reported a jump in Covid-linked ICU cases and surging hospitalizations after the Thanksgiving holiday, threatening an extension of lockdown measures. The US Food and Drug Administration (FDA) will meet outside experts on Thursday to discuss whether to recommend a wider distribution of Pfizer’s vaccine after giving the green light on emergency-use authorization on Tuesday. Meanwhile, Canada became the latest major economy to approve Pfizer’s vaccine.
Sentiment appears to have leaned towards the cautious side as the US Dollar – a perceived haven currency – rebounded from a 2.5-year low. The VIX volatility index climbed to 23.8 overnight. Asia-Pacific equities may follow bearish US lead lower today, with technology sector more susceptible to a pullback.
DXY US Dollar Index
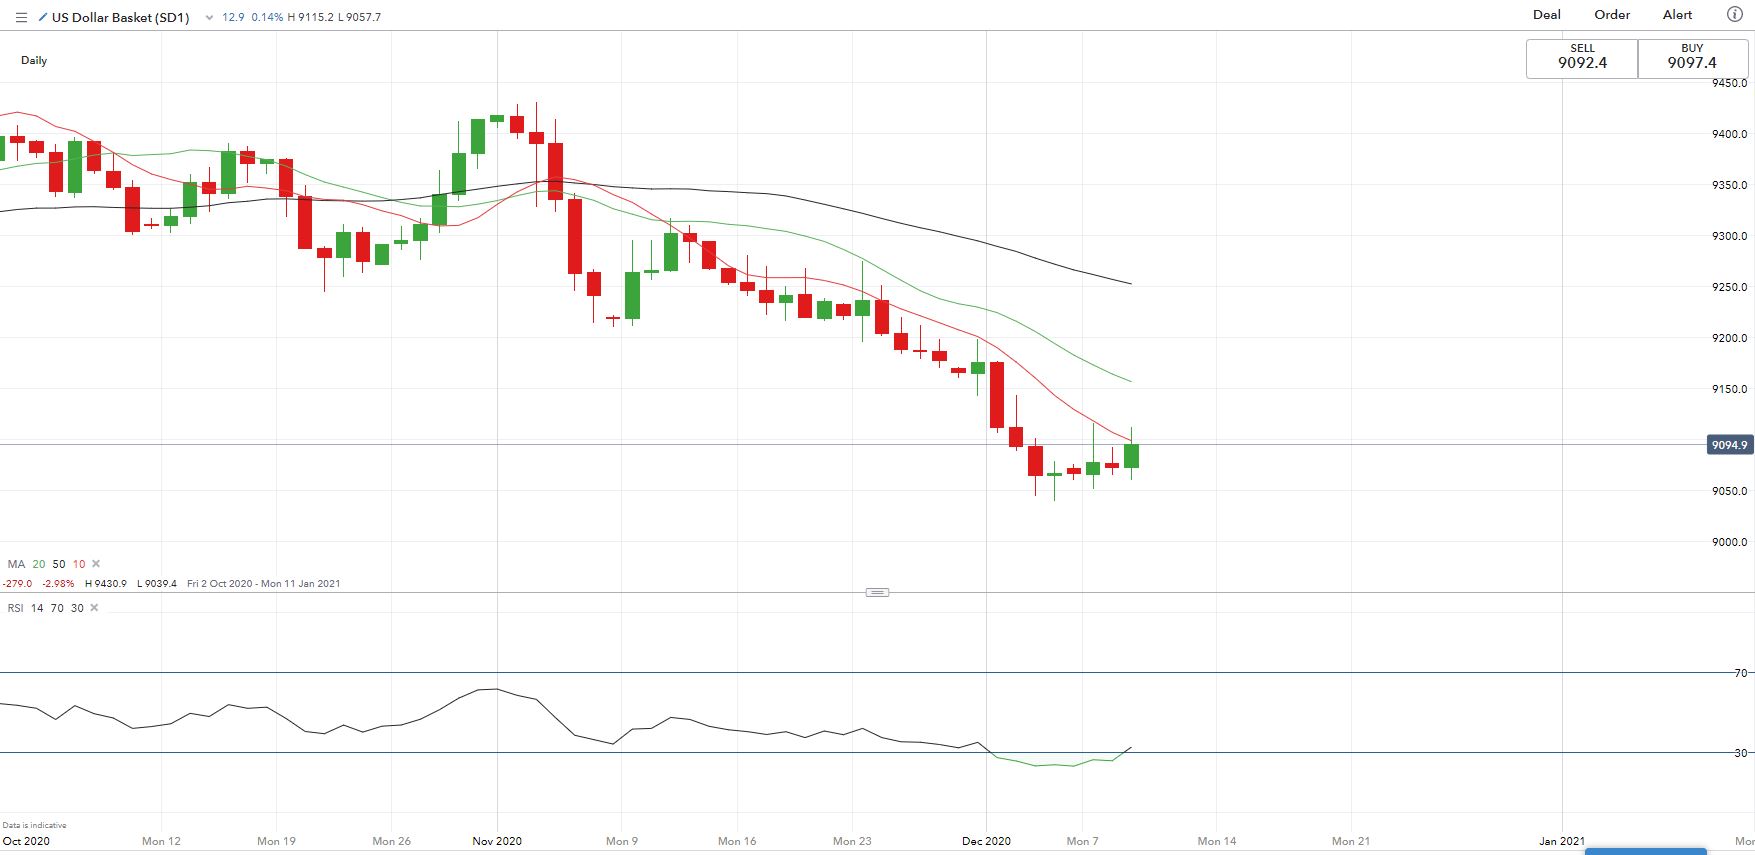
Chart from IG
On the macro front, currency traders will closely watch the ECB meeting later today. The central bank is expected to keep interest rates unchanged while increasing the bond-purchasing program to cushion the impact brought by another pandemic wave. Aside from that, UK GDP figures and US core inflation data are also among top events today. Find out more on the DailyFX economic calendar.

Sector-wise, 4 out of 9 Dow Jones sectors ended lower, with half of the index’s constituents closing in the red on Wednesday. Consumer discretionary (+0.63%) , communication services (+0.33%%) and materials (+0.20%) were doing the heavy lifting, while information technology (-1.65%) and energy (-1.20%) were among the worst performers.
Dow Jones Sector Performance 09-12-2020

Source: Bloomberg, DailyFX

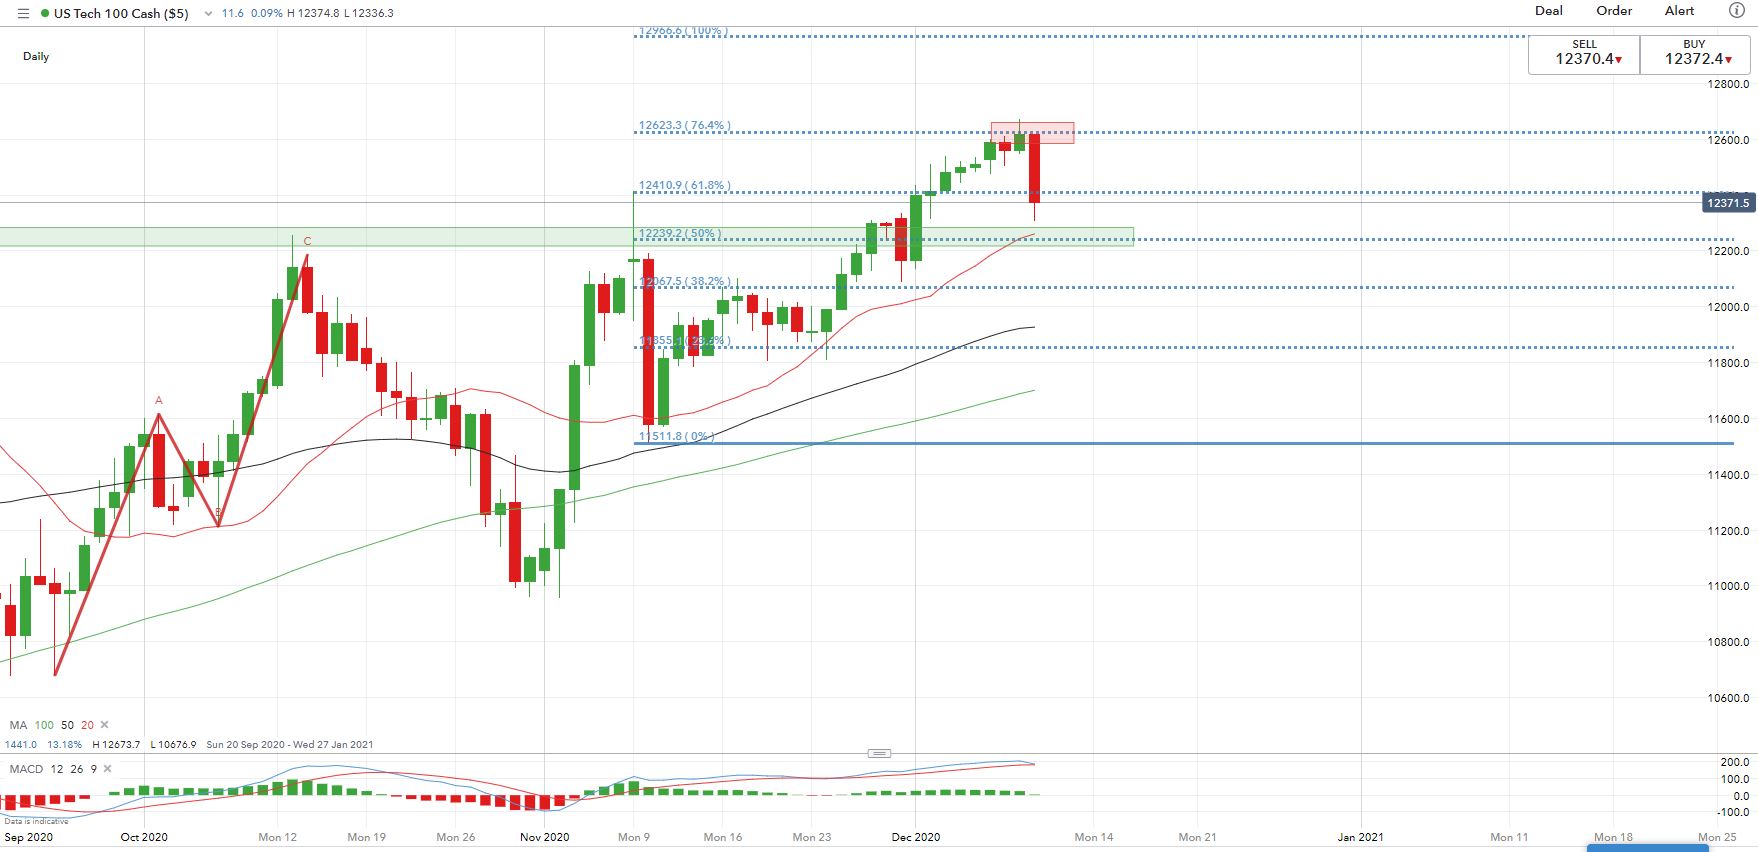
Nasdaq 100 Technical Analysis:
The Nasdaq 100 index appears to have hit the 76.4% Fibonacci extension level of 12,620 and has since entered a consolidation phase. An immediate support level can be found at 12,240, where the 20-Day Simple Moving Average (SMA) line and the 50% Fibonacci extension level intercept. Breaking this level may open the door for further losses. The overall trend remains bullish-biased, although a technical correction seems to be underway.
Nasdaq 100 Index – Daily Chart
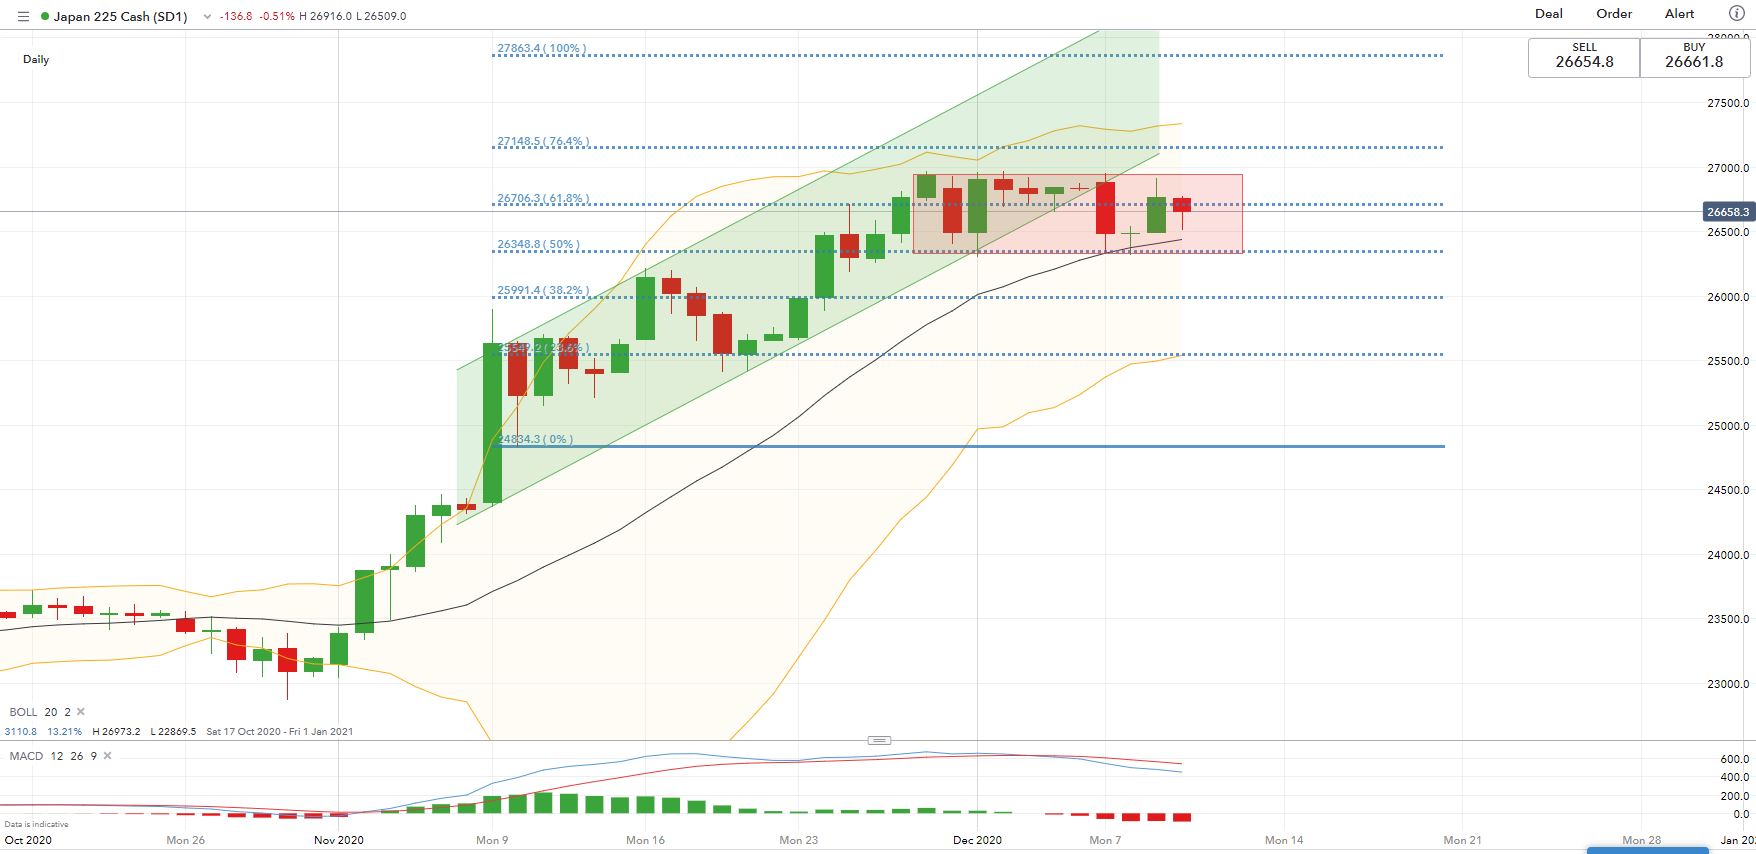
Nikkei 225 Index Technical Analysis:
Technically, the Nikkei 225 index has likely broken the lower bound of its “Ascending Channel” (chart below) and has since entered a consolidative period (highlighted in chart below). An immediate support level can be found at 26,350 - the 50% Fibonacci extension, whereas an immediate resistance level can be found at 27,000.
Nikkei 225 Index – Daily Chart
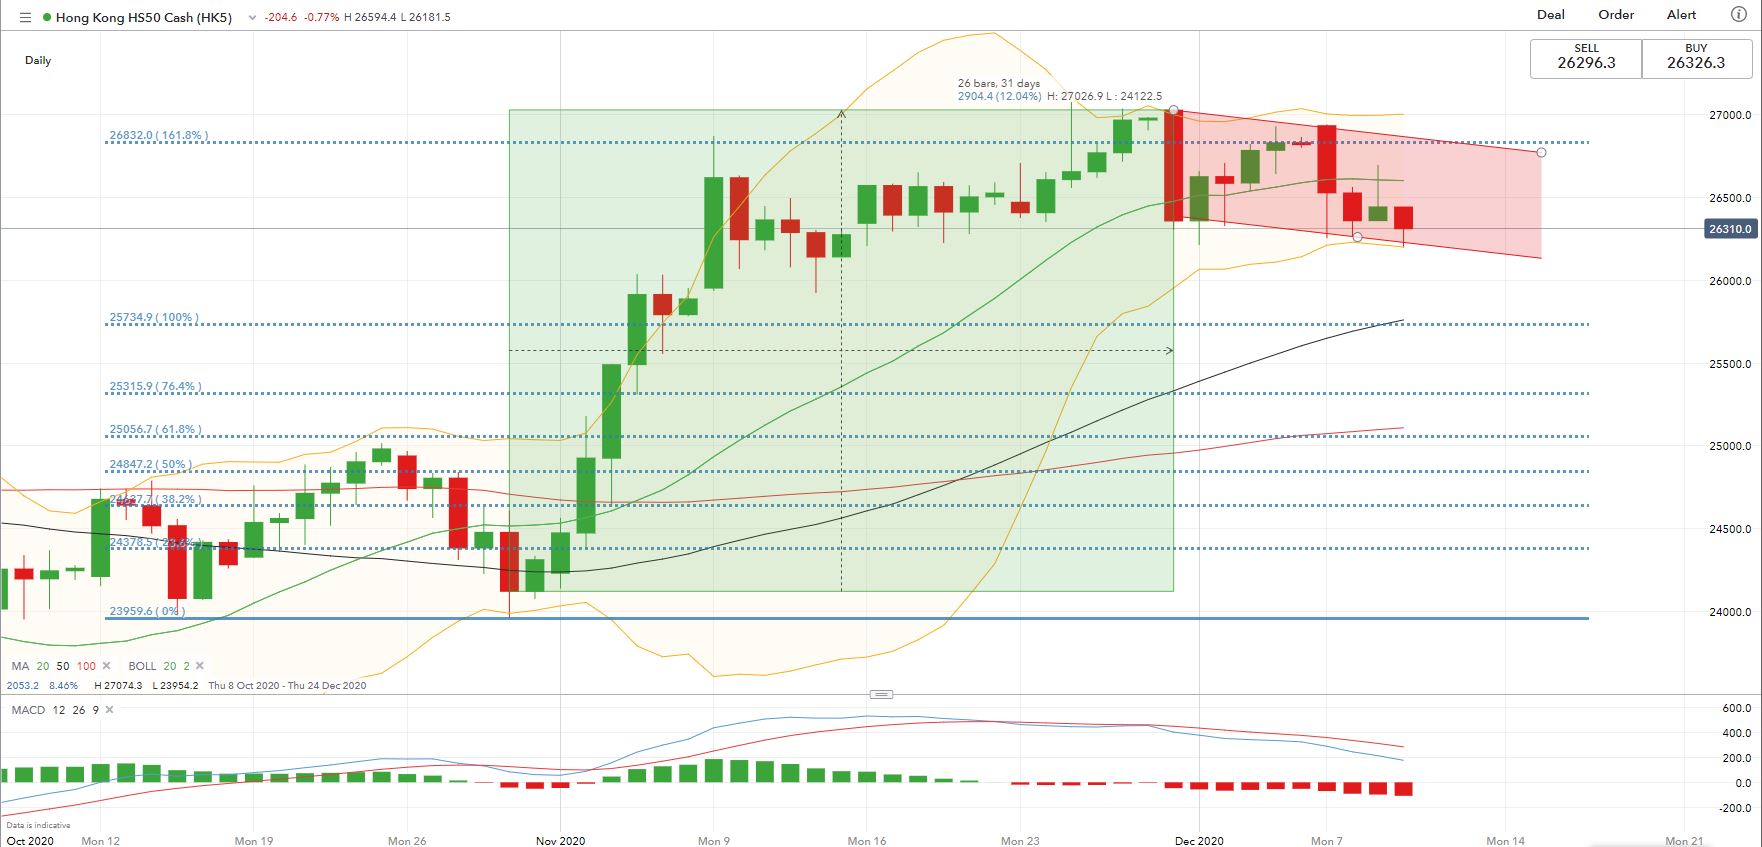
Hang Seng Index Technical Analysis:
Upward momentum appears to be fading for Hang Seng Index (HSI), which has likely entered a consolidative phase on November 30. The MACD indicator formed a “Death Cross” and trended lower since, reflecting bearish momentum. The index has also pierced below the middle Bollinger Band line, pointing to a possible trend reversal.
Hang Seng Index – Daily Chart

--- Written by Margaret Yang, Strategist for DailyFX.com
To contact Margaret, use the Comments section below or @margaretyjy on Twitter


