


USD/JPY ANALYSIS
- Long-term trend remains bearish
- Upcoming US inflation data
- IG Client Sentiment (IGCS) mixed
The safe-haven Japanese Yen (JPY) has remained resilient against the US Dollar in spite of vaccine optimism and a broadly risk-on global sentiment. While the Yen has fallen against most other major currencies, USD/JPY remains under pressure.
TECHNICAL ANALYSIS

USD/JPY Daily Chart:
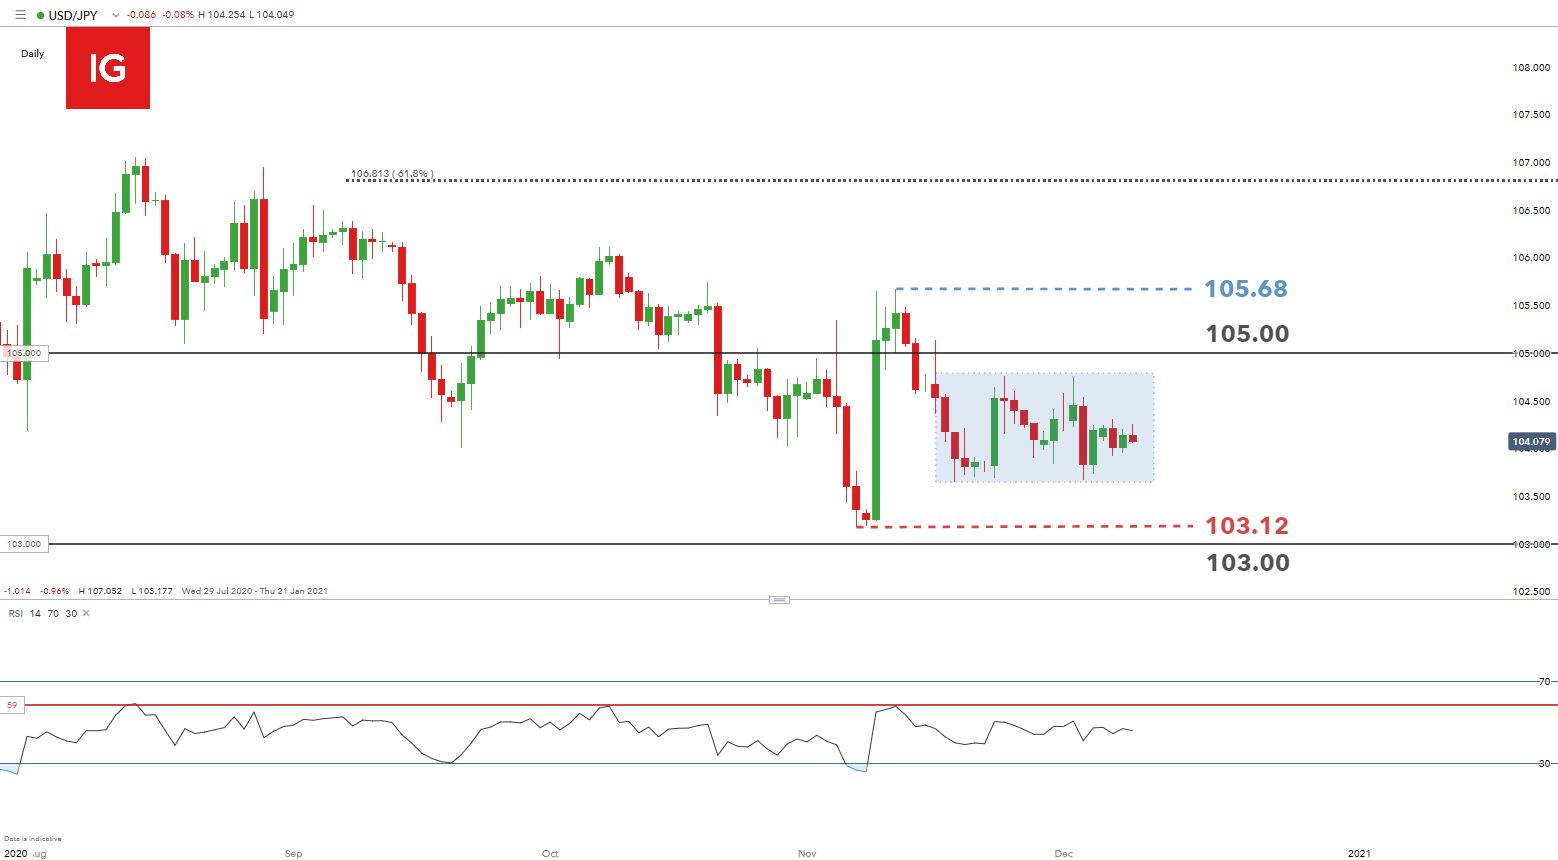
Chart prepared by Warren Venketas, IG
USD/JPY price action has reverted to a sideways movement since mid-November with evident support and resistance zones. These candles have formed a rectangle pattern (blue) preceded by a bearish/downward trend. This is more commonly referred to as a bearish rectangle pattern which suggests the potential for further downside should prices break below support.
The bearish case remains with the November swing low 103.12 providing initial support should the breakout below rectangle support occur with the 103.00 psychological level as the secondary target.
The less likely, but still possible, case for an upside break above rectangle resistance could bring the key 105.00 horizontal level in to consideration with further resistance at 105.68 (November swing high).
The Relative Strength Index (RSI) substantiates price action as it is currently around the 50 level which implies no directional bias. The 59 level (red) remains as resistance on this indicator as price has topped at this level in the last few months. Should price push toward this level, it should be monitored as the level has been established as a key area of confluence.
Further your knowledge with other popular continuation patterns include the rising wedge, falling wedge and pennant patterns !
MINIMAL CHANGE EXPECTED IN US INFLATION DATA
Today’s inflation announcement is estimated to have negligible impact on the USD/JPY as forecasts are roughly in line with previous figures. Should actual figures deviate significantly from estimates there may be large price action swings.
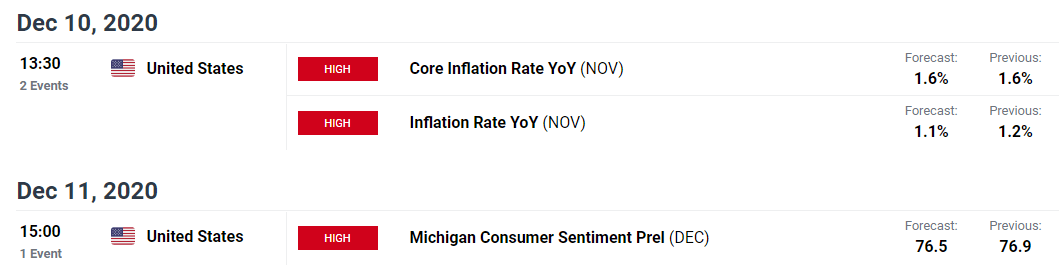

Key points to consider:
IG CLIENT SENTIMENT SUPPORTIVE OF TECHNICAL CONSOLIDATION
| Change in | Longs | Shorts | OI |
| Daily | -2% | 2% | 0% |
| Weekly | 12% | -16% | -6% |
IGCS shows retail traders are currently net long on USD/JPY, with 66% of traders currently holding long positions (as of this writing). At DailyFX we typically take a contrarian view to crowd sentiment, and the fact traders are net-long is suggestive of a bearish bias on the pair however, due to a higher net change in short positions relative to long positions we settle at a mixed signal.
--- Written by Warren Venketas for DailyFX.com
Contact and follow Warren on Twitter: @WVenketas


