


The falling wedge pattern (also known as the descending wedge) is a useful pattern that signals future bullish momentum. This article provides a technical approach to trading the falling wedge, using forex and gold examples, and highlights key points to keep in mind when trading this pattern.
What is a falling wedge pattern?
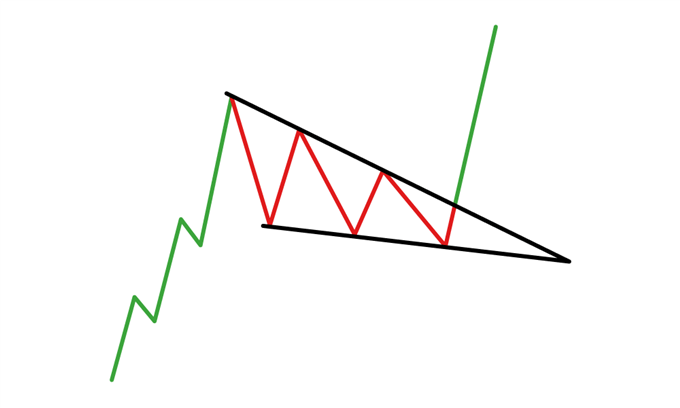
The falling wedge pattern is a continuation pattern formed when price bounces between two downward sloping, converging trendlines. It is considered a bullish chart formation but can indicate both reversal and continuation patterns – depending on where it appears in the trend.
Rising Wedge Pattern
The rising wedge pattern is the opposite of the falling wedge and is observed in down trending markets. Traders ought to know the differences between the rising and falling wedge patterns in order to identify and trade them effectively.
How to Identify a Falling Wedge Pattern
The falling wedge pattern is interpreted as both a bullish continuation and bullish reversal pattern which gives rise to some confusion in the identification of the pattern. Both scenarios contain different market conditions which must be taken into consideration.
The differentiating factor that separates the continuation and reversal pattern is the direction of the trend when the falling wedge appears. A falling wedge is a continuation pattern if it appears in an uptrend and is a reversal pattern when it appears in a downtrend.
Continuation or (Reversal) Pattern:
- Identify an uptrend or (downtrend)
- Link lower highs and lower lows using a trend line. The two lines will slope downwards and converge
- Look for divergence between price and an oscillator like the RSI or stochastic indicator
- Oversold signal can be confirmed by other technical tools like oscillators
- Look for break above resistance for a long entry

How to Trade the Falling Wedge Pattern
Below are various ways to trade the falling wedge using technical analysis:
1) Falling Wedge Continuation Pattern
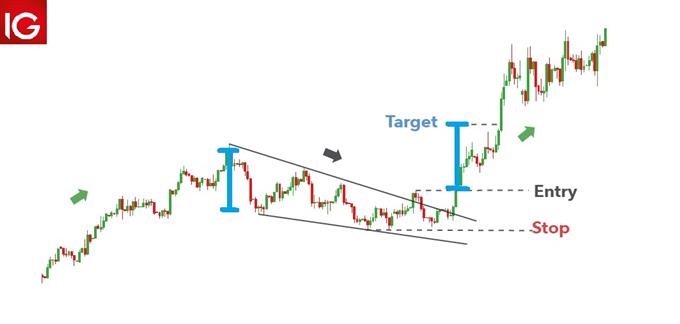
The descending wedge pattern appears within an uptrend when price tends to consolidate, or trade in a more sideways fashion. Connecting the lower highs and lower lows will reveal the slight downward slant to the wedge pattern before price eventually rises, resulting in a falling wedge breakout to resume the larger uptrend.
In the Gold chart below, it is clear to see that price breaks out of the descending wedge to the upside only to return back down. This is a fake breakout or “fakeout” and is a reality in the financial markets. The fakeout scenario underscores the importance of placing stops in the right place – allowing some breathing room before the trade is potentially closed out. Traders can place a stop below the lowest traded price in the wedge or even below the wedge itself. or even below the wedge itself.
Setting the stop loss a sufficient distance away allowed the market to eventually break through resistance (legitimately) and resume the long-term uptrend.

Measuring Technique to Set Target Levels
Traders can look to the starting point of the descending wedge pattern and measure the vertical distance between support and resistance. Then, superimpose that same distance ahead of the current price but only once there has been a breakout. The top end of the line will be the target.
2) Falling Wedge Reversal Pattern
Traders can make use of falling wedge technical analysis to spot reversals in the market. The USD/CHF chart below presents such a case, with the market continuing its downward trajectory by making new lows. Price action then start to trade sideways in more of a consolidation pattern before reversing sharply higher.
Traders can use trendline analysis to connect the lower highs and lower lows to make the pattern easier to spot. A break and close above the resistance trendline would signal the entry into the market. A stop loss can be placed below the recent swing low, while the target can be placed according to the measurement technique discussed above; or at a previous level of resistance - while adhering to positive risk to reward ratio.
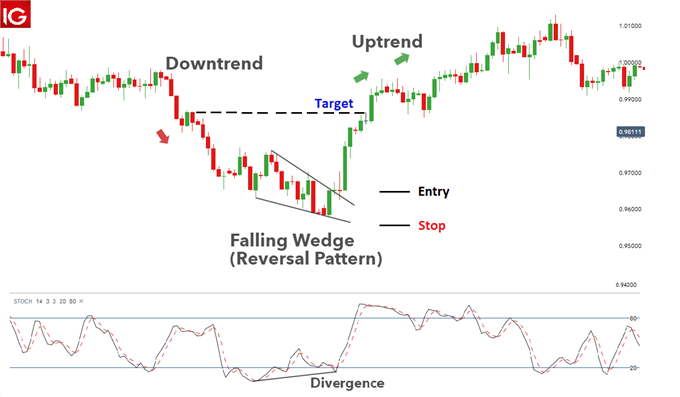
Confirmation: Traders can look to the volume indicator to see higher volume (greater conviction) in the move up. Additionally, divergence can be observed as the market is making lower lows but the stochastic indicator is making higher lows – this indicates a potential reversal.
Key points to remember:
- Identification of the trend is crucial
- Both continuation and reversal scenarios are inherently bullish
- Both patterns present favourable risk to reward ratios as they generally precede big moves
Advantages and Limitations of the Falling Wedge
| Advantages | Disadvantages |
|---|---|
| Occurs frequently within financial markets | Can be ambiguous to novice traders |
| The falling wedge pattern allows traders to get into a trending market after missing the initial move (continuation case) | Requires additional confirmation using other technical indicators and oscillators |
| Presents clear stop, entry and limit levels | Often identified incorrectly |
| Opportunity for favourable risk-reward ratios | The falling wedge can signify a reversal or continuation pattern (essential to identify this correctly) |
Further Reading on Forex Trading Patterns
- Consider other chart patterns like the head and shoulders, double top and double bottom in order to develop your pattern recognition.
- How well do you know your trading patterns? Test yourself with our interactive forex trading patterns quiz.
- At DailyFX we researched over 100,000 live IG Group accounts to find out the secrets of successful traders and published the findings in our Traits of Successful Traders guide.