


S&P 500, NIKKEI 225, ASIA-PACIFIC MARKET OUTLOOK:
- US equity index futures rebounded after falling on Monday, setting a positive tone for APAC
- Concerns about a potential post-Thanksgiving viral resurgence weighed on sentiment
- Australia’s ASX 200 index is testing the 20-Day Simple Moving Average, RBA meeting in focus
Asia-Pacific stocks are struggling after Wall Street equities broadly retreated on Monday, ending an astonishing month with a souring tone. Energy, financials, utilities and industrials were among the hardest hit, whereas information technology and healthcare were doing the heavy lifting overnight. Pfizer’s share price surged 2.9% after reports saying that the UK will allow hospitals to receive its Covid-19 vaccine soon. Meanwhile, Moderna is seeking the FDA’s approval for emergency use of its vaccine, closely following Pfizer. Currency traders will be closely watching the RBA interest rate decision to be released at 3:30 GMT.
Nonetheless, markets appear to be worrying about a potential resurgence in coronavirus infections after the Thanksgiving break, during which travel and social interactions leaped. Covid-19 hospitalizations hit a record in the US, with daily new cases registering 136,313 on November 29th.
Stock markets are perhaps experiencing another round of healthy correction after registering decent gains lately, and there seems to be little fear as volatility retreats. The VIX volatility index continued its downward trajectory, reaching its lowest level seen since end-February.
VIX Volatility Index
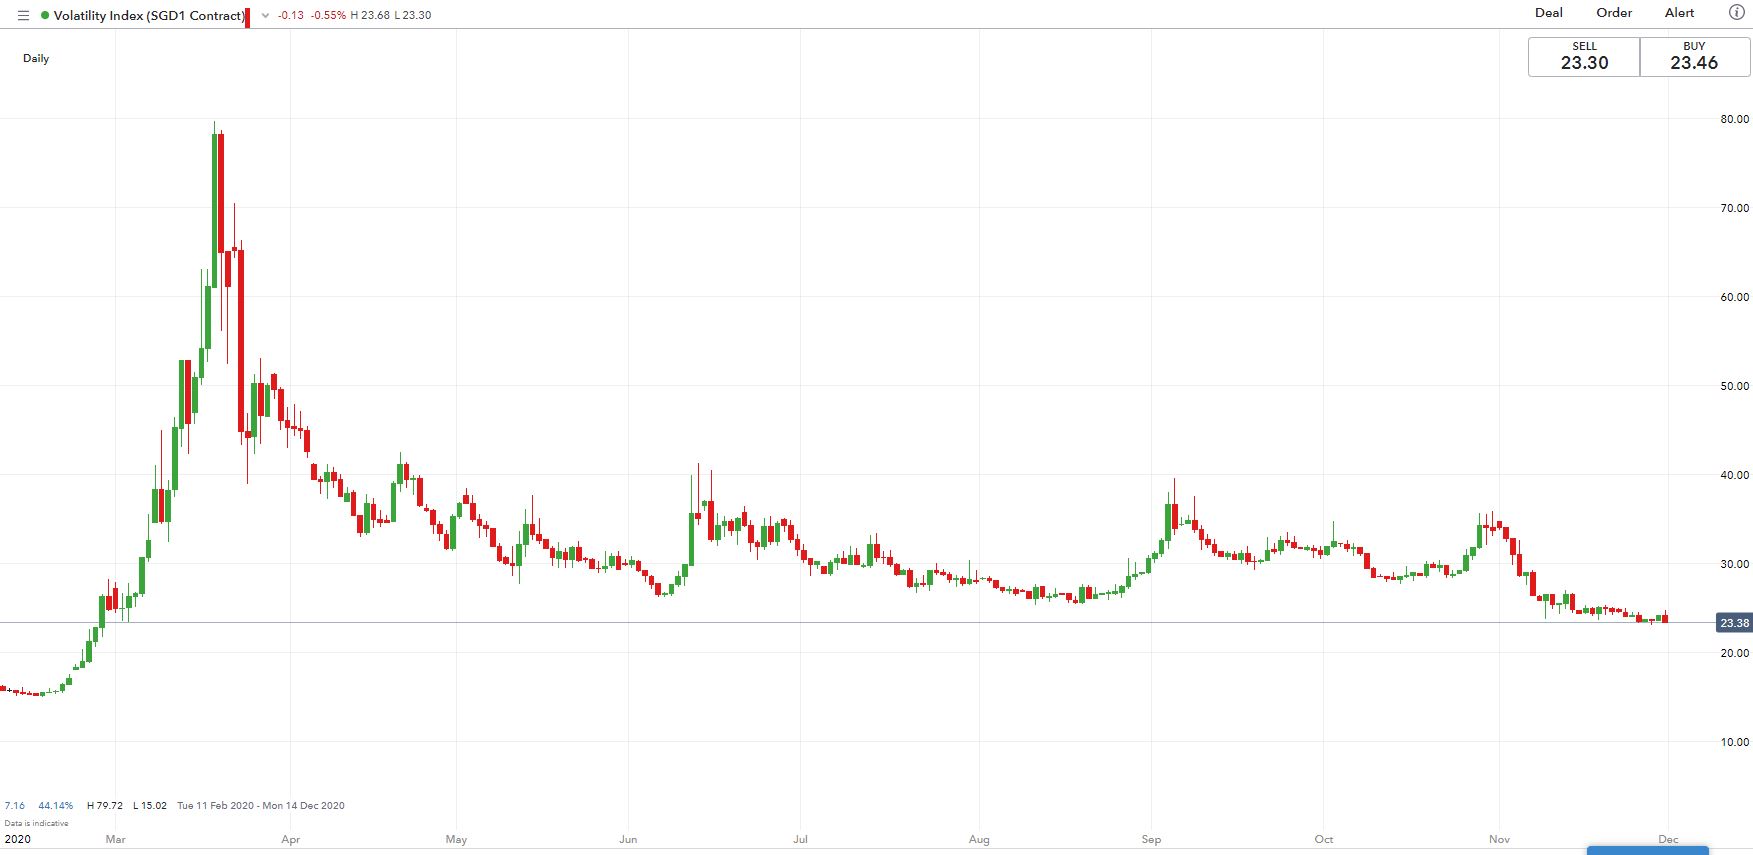
Chart from IG
Crude oil prices are trading lower after OPEC+ postponed a meeting to December 3rd amid dissent about production hikes. WTI fell from recent highs and entered into a consolidative period due to profit taking and uncertainties surrounding the OPEC+ decision.

Sector-wise, 9 out of 11 S&P 500 sectors closed in the red, with 70.9% of the index’s constituents ending lower. Information technology (+0.66%) and healthcare (+0.29%) were doing the heavy lifting, whereas energy (-5.37%), financials (-1.92%) and utilities (-1.47%) were among the worst performers.
S&P 500 Sector Performance 30-11-2020

Source: Bloomberg, DailyFX
On the macro front, the RBA interest rate decision and a string of Markit manufacturing PMIs from South Korea, India, Russia, Spain, Italy, Germany and the Eurozone will be closely watched. The US ISM manufacturing PMI is due tonight too. Fed Chair Jerome Powell will give his testimony at a congressional hearing on Tuesday. Read more on DailyFX’s economic calendar.

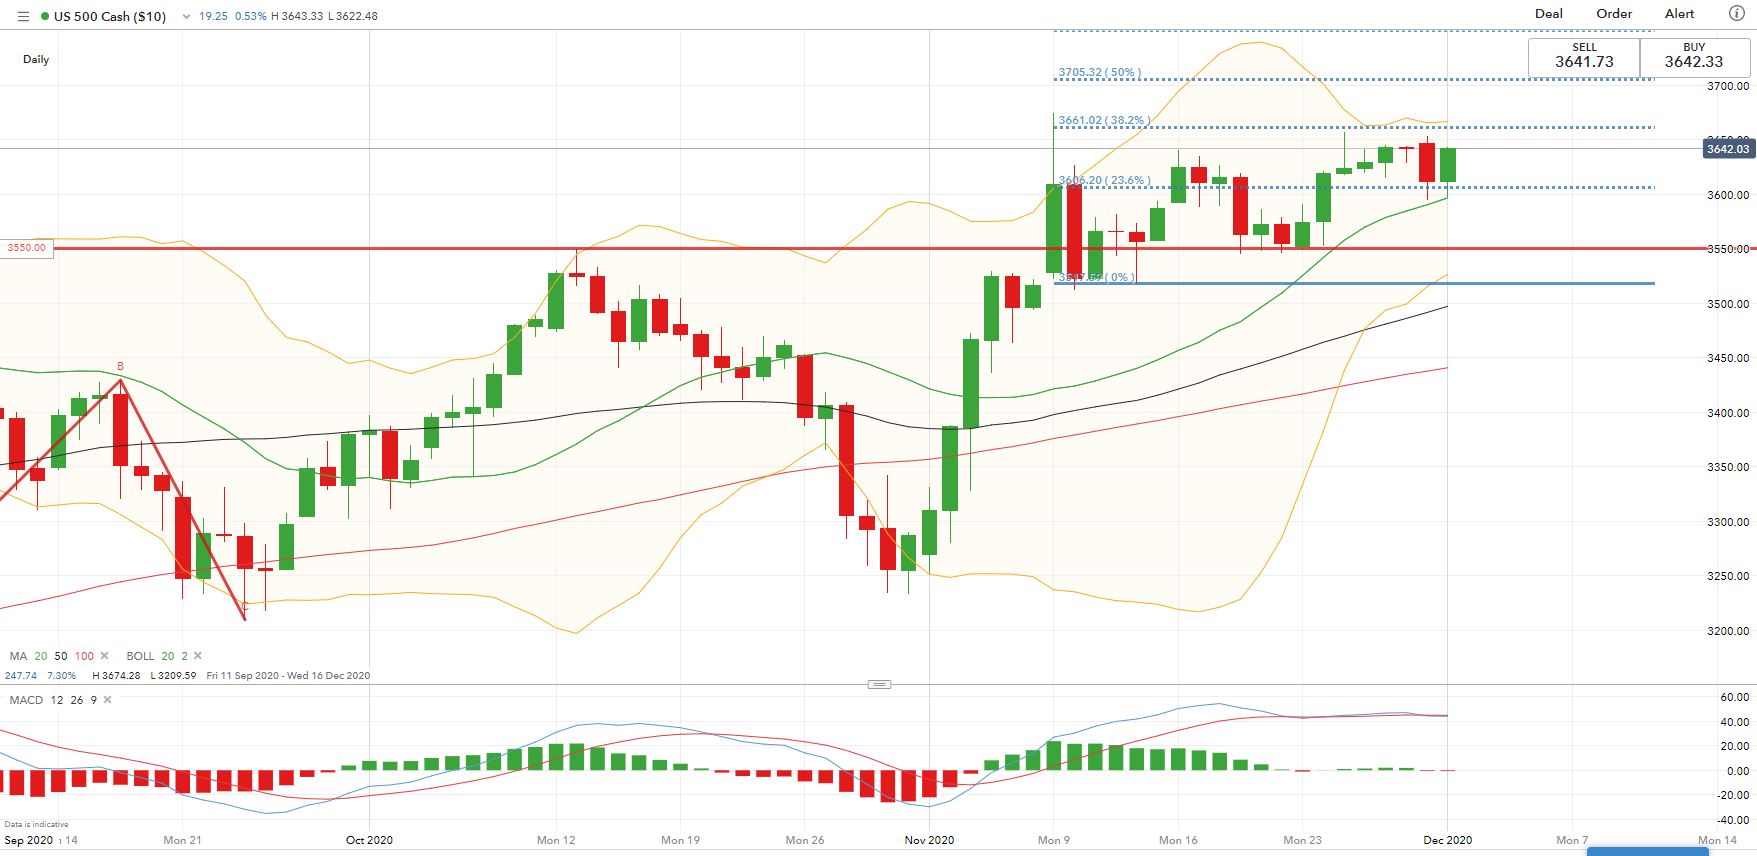
S&P 500 Index Technical Analysis:
The S&P 500 index appears to be riding a bumpy bull trend since November. The uptrend was well supported by its 20-Day Simple Moving Average (SMA) line, although some short-term pullbacks were observed. Immediate support and resistance level can be found at 3,606 (23.6% Fibonacci extension) and 3,660 (38.2% Fibonacci extension) respectively. Narrowing Bollinger Band width points to a weakening upward momentum however, which suggests further consolidations.
S&P 500 Index – Daily Chart
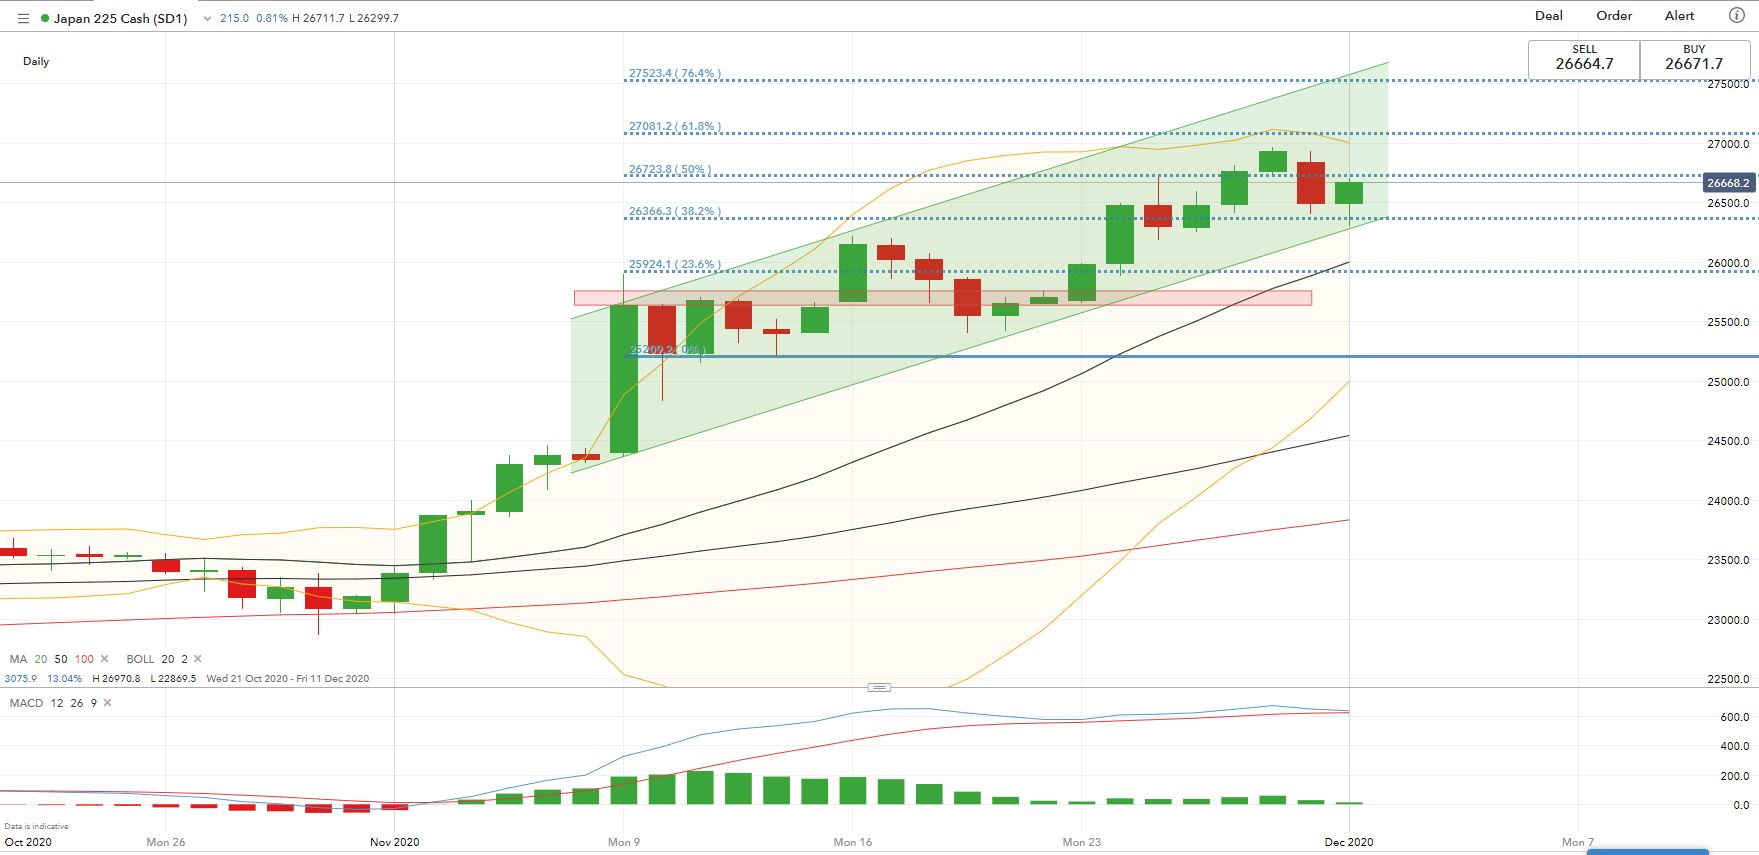
Nikkei 225 Index Technical Analysis:
The Nikkei 225 index is riding an upward trend as highlighted in the green channel below. The ascending trend remains intact albeit some short-term pullback is possible. An immediate support level can be found at 26,366 – the 23.6% Fibonacci extension. The upper Bollinger Band may serve as a dynamic resistance level. An MACD divergence appears to be forming, highlighting risk of a potential trend reversal.
Nikkei 225 Index – Daily Chart
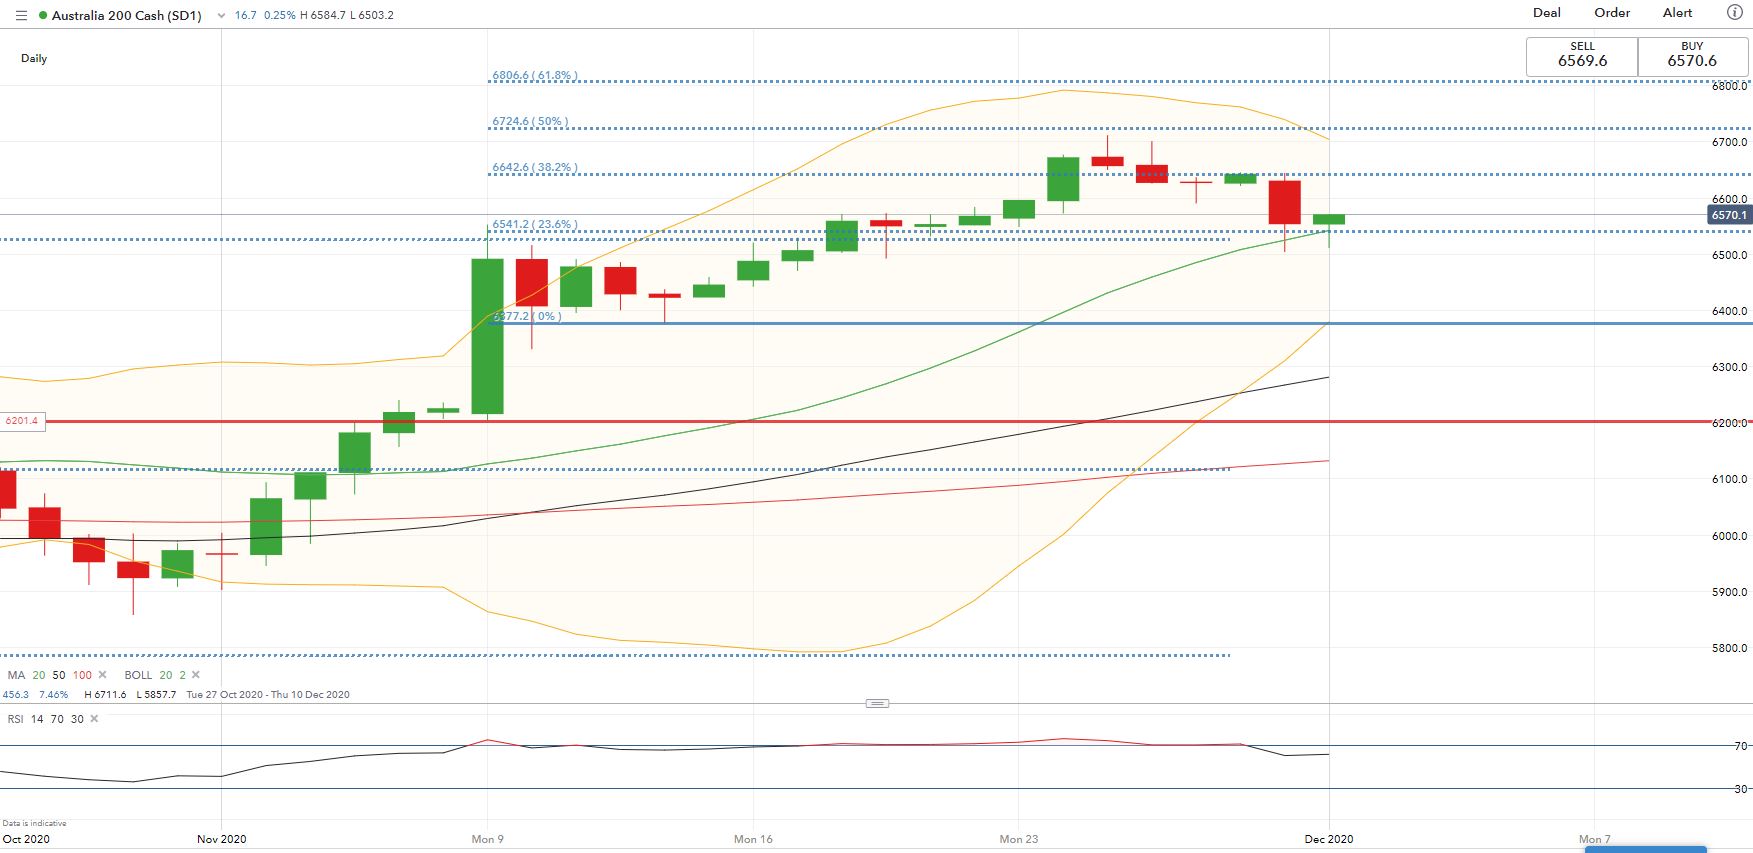
ASX 200 Index Technical Analysis:
The ASX 200 index entered a brief correction after hitting a 9-month high. The overall bullish trend remains intact though, as suggested by upward-sloped SMAs. The index is testing a key support level of 6,540 – where its 23.6% Fibonacci extension and 20-Day SMA overlap. Holding above this level may pave the way for further upside potential towards 6,640 – the 38.2% Fibonacci extension.
ASX 200 Index – Daily Chart

--- Written by Margaret Yang, Strategist for DailyFX.com
To contact Margaret, use the Comments section below or @margaretyjy on Twitter


