


Gold (XAU/USD) Analysis, Price and Chart
- Gold running into increased headwinds.
- Traders are heavily long but the sentiment is positive.
The latest upbeat vaccine news from Moderna has reinforced last week’s risk-on drive, boosting riskier and weighing on safe-haven alternatives. Monday’s risk move was not as sharp as last week’s strong momentum drive but it did underpin riskier assets at current levels and should continue to do so over the short-term. This positive vaccine news is now starting to drive the growth narrative and this can be seen in the US Treasury market with bond yields edging higher despite the central bank’s ongoing bond-buying program. The Fed currently buys USD80 billion a month of US Treasuries and USD40 billion a month of mortgage-backed securities. While the Fed will be keeping an eye on US Treasury yields, the 10-year, currently offered around 0.915%, maybe allowed to drift higher to 1.00% to steepen the yield curve slightly as growth prospects increase.
How to Trade Gold: Top Gold Trading Strategies and Tips
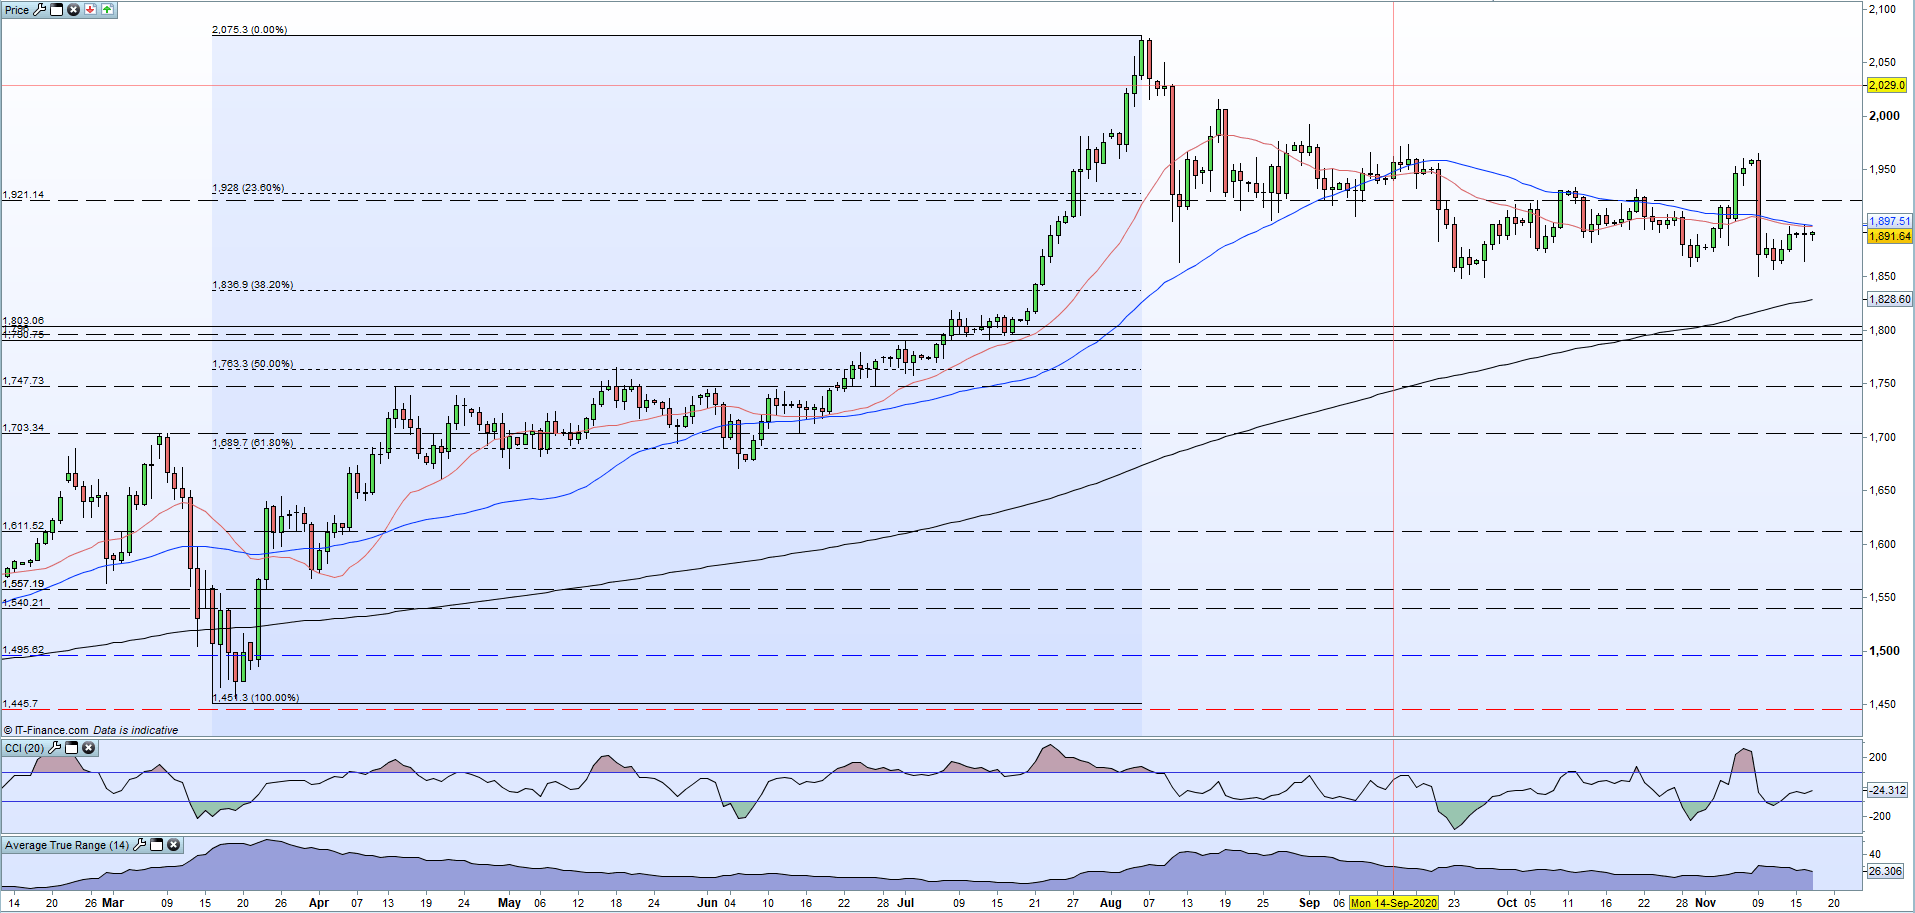
The chart is now dominated by last Monday’s sell-off candle and price action is expected to be constrained within this range. Yesterday’s candle showed the current indecision in the market and today’s narrow trading range also suggests that traders are still undecided about the next move. The 20- and 50-day simple moving averages are acting as short-term resistance just under $1,900/oz. with the 23.6% fib retracement next up at $1,928/oz. There seems to be reasonable short-term support for gold from recent low prints just under $1,850/oz.
Gold Daily Price Chart (February – November 17, 2020)
| Change in | Longs | Shorts | OI |
| Daily | 1% | -3% | -1% |
| Weekly | 2% | -8% | -2% |
IG retail trader datashow 80.15% of traders are net-long with the ratio of traders long to short at 4.04 to 1. We typically take a contrarian view to crowd sentiment, and the fact traders are net-long suggests Gold prices may continue to fall. However, traders are less net-long than yesterday and compared with last week. Recent changes in sentiment warn that the current Gold price trend may soon reverse higher despite the fact traders remain net-long.

What is your view on Gold – are you bullish or bearish?? You can let us know via the form at the end of this piece or you can contact the author via Twitter @nickcawley1.


