


Gold (XAU/USD) Analysis, Price and Chart
- Gold under further downside pressure.
- Monday’s wipeout candle will hold back any bullish intent.
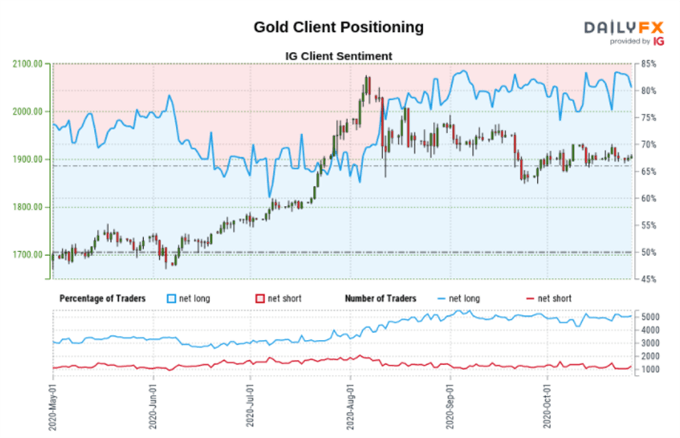
- Client sentiment is bearish.
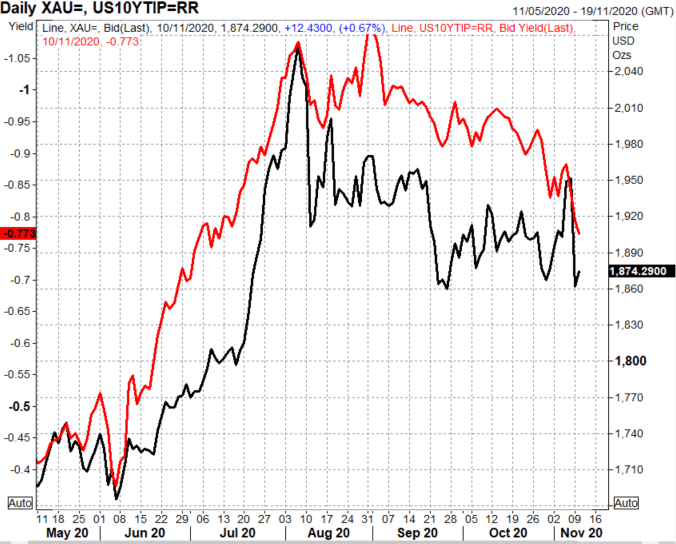
Gold remains under pressure despite a small pick-up from Monday’s low print at $1,850/oz. The precious metal shed in excess of $100/oz. at one point yesterday as risk markets grabbed a huge bid on positive Covid-19 vaccine news. Traditional safe-haven assets, including gold, fell victim to the rush for risk, with the precious metal wiping out six-weeks’ worth of gains in one session. The US dollar also lost some of its safe-haven allure, but rising US Treasury yields and narrowing US real yields, underpinned the greenback and weighed on gold.
The closely followed 10-year US Treasury hit a yield of 0.94% Monday, a fresh eight-month high, as investors dropped safe-haven assets. The yield on the benchmark 10-year was also under pressure from dealers and investors pushing the price down/yield up ahead of this week’s sizeable 3-, 10- and 30-year US bond auctions. Yesterday $54 billion 3-year notes were priced, today investors will be offered $41 billion 10-year notes, while on Thursday $27 billion 30-year bonds will be sold. Rising US Treasury yields are also forcing US real yields to narrow/become less negative, a further bearish set-up for gold.
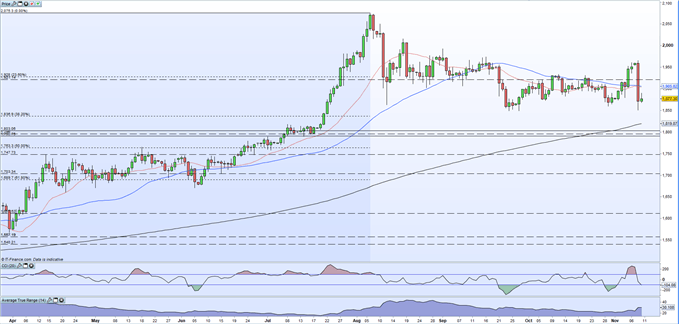
The daily gold chart shows a large bearish engulfing candle made on Monday, wiping out the best part of six-weeks’ worth of gains. This candlestick will crimp further upside and may cause further falls in the precious metal. The downside should find initial support around yesterday’s low at $1,850/oz. which lines up with the double low print at the end of September. Below here, the 38.2% Fibonacci retracement at $1,836/oz. before the 200-day simple moving average at $1,819/oz. Initial resistance around $1,900 - $1,905/oz. off the big figure and the 20- and 5-day sma.
Gold Daily Price Chart (March – November 10, 2020)
| Change in | Longs | Shorts | OI |
| Daily | 1% | -3% | -1% |
| Weekly | 2% | -8% | -2% |
IG retail trader datashow 87.93% of traders are net-long with the ratio of traders long to short at 7.29 to 1, a bearish contrarian signal. Traders are further net-long than yesterday and last week, and the combination of current sentiment and recent changes gives us a stronger Gold-bearish contrarian trading bias.

What is your view on Gold – are you bullish or bearish?? You can let us know via the form at the end of this piece or you can contact the author via Twitter @nickcawley1.


