


Gold (XAU/USD) and Silver (XAG/USD) Analysis, Prices and Charts
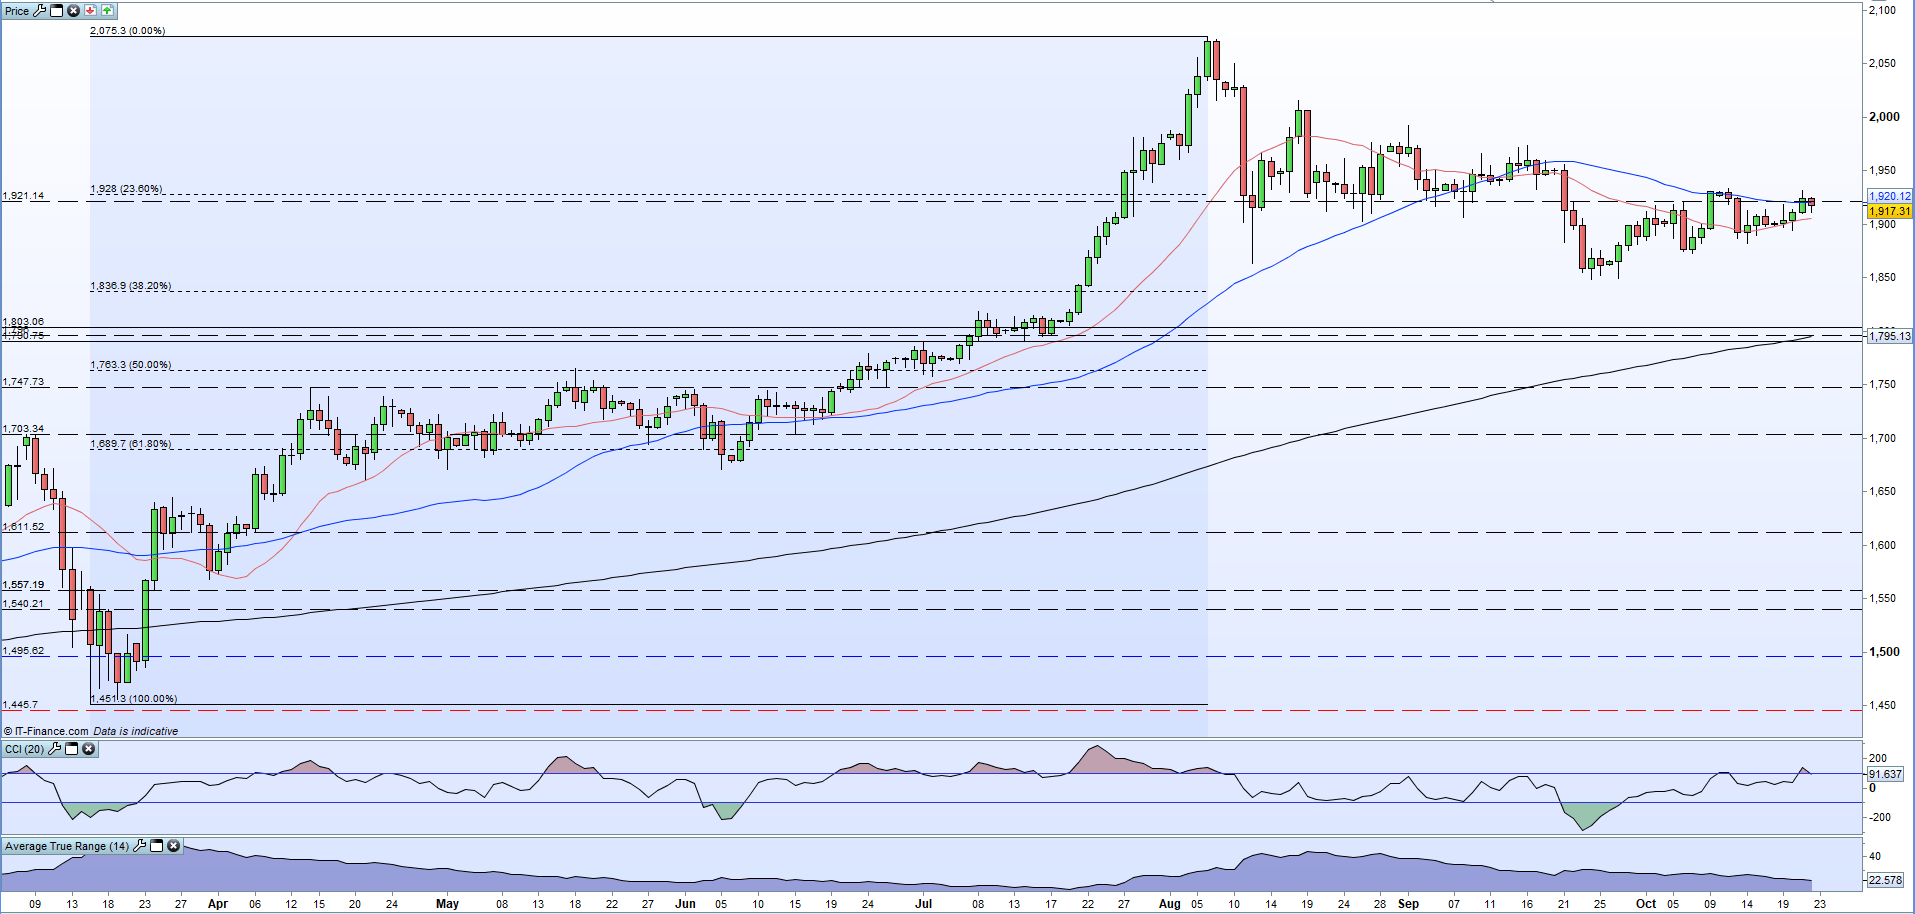
Gold continues to print fresh short-term higher lows and the precious metal is currently trapped between the supportive 20-day simple moving average (sma) at $1,905/oz. and resistance off the 50-day sma around $1,921/oz. A break to the downside exposes $1,882/oz. while a break higher will see the 23.6% Fibonacci retracement at $1,928/oz. and the one-month high at $1,934.5/oz. come into play. The CCI indicator suggests that gold is overbought for the first time since early August.
Gold Daily Price Chart (March – October 22, 2020)
| Change in | Longs | Shorts | OI |
| Daily | 1% | -3% | -1% |
| Weekly | 2% | -8% | -2% |
IG retail trader datashow 79.05% of traders are net-long with the ratio of traders long to short at 3.77 to 1.The number of traders net-long is 0.11% lower than yesterday and 4.13% lower from last week, while the number of traders net-short is 9.59% lower than yesterday and 8.29% higher from last week.
We typically take a contrarian view to crowd sentiment, and the fact traders are net-long suggests Gold prices may continue to fall.Positioning is more net-long than yesterday but less net-long from last week. The combination of current sentiment and recent changes gives us a further mixed Gold trading bias.

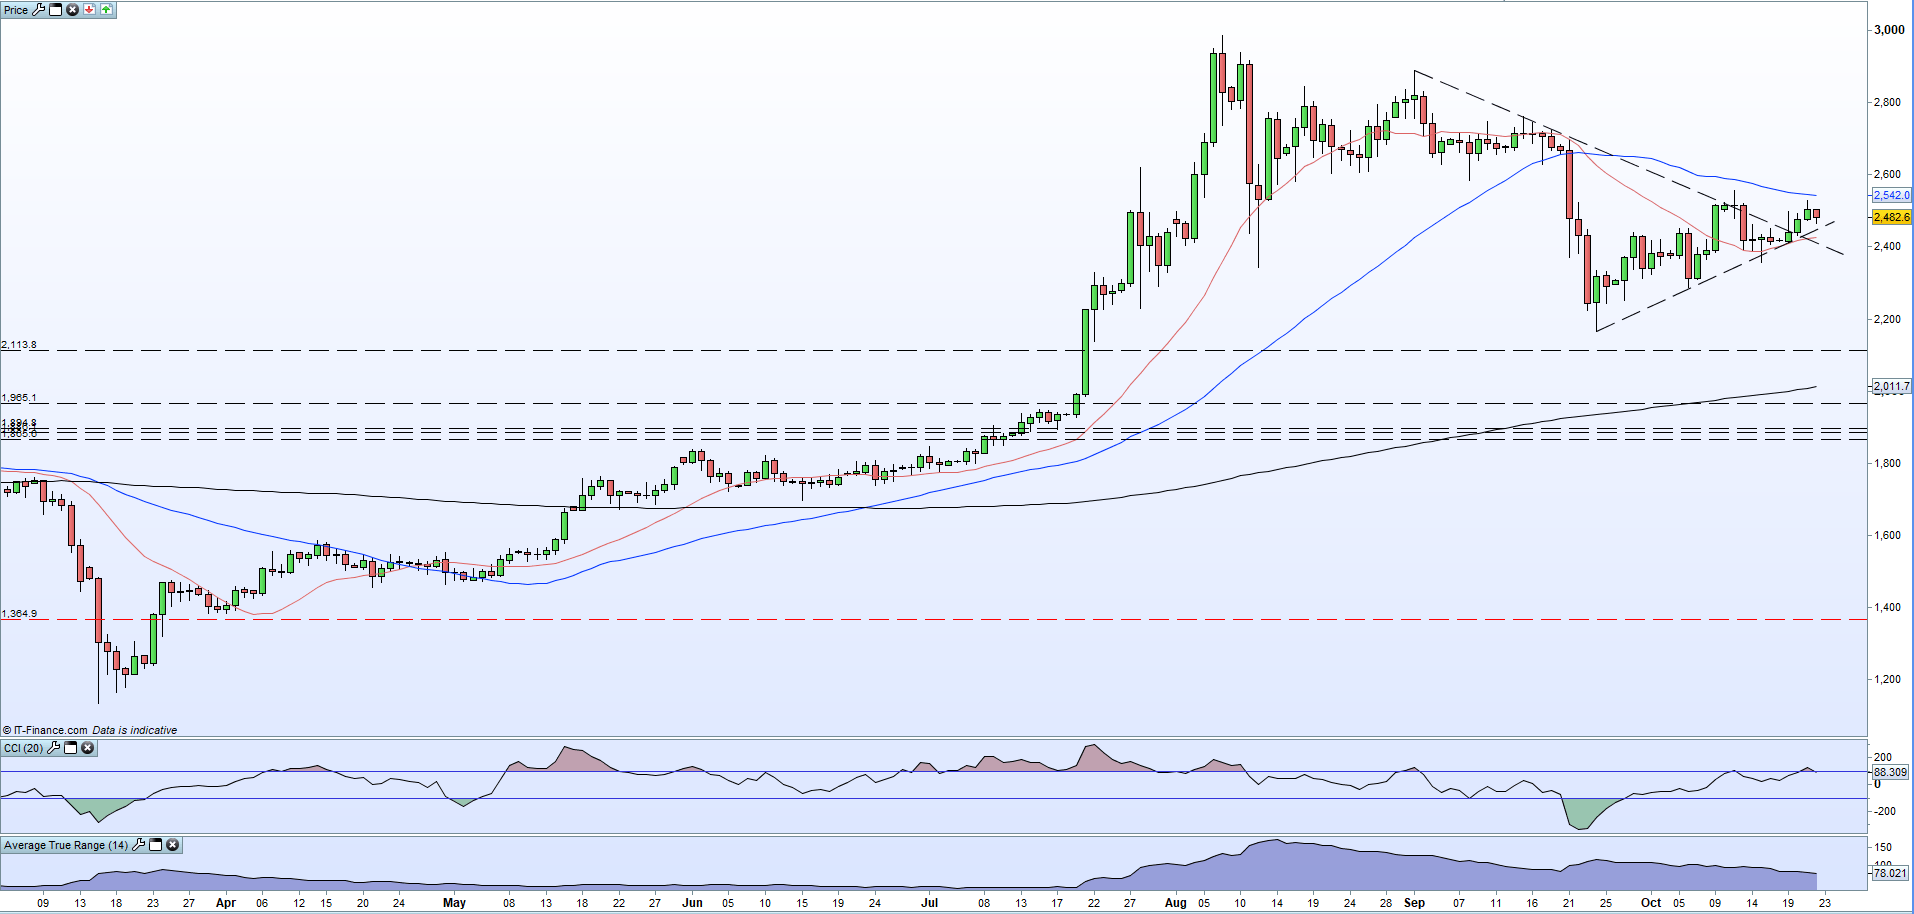
The short-term supportive trendline continues to guide silver higher, with the 20-day sma acting now as secondary support. We noted the pennant formation nearing its apex at the end of last week and the subsequent break higher now suggests that silver may have more room to run. The 50-day sma at 25.41 is the first level of resistance followed by the multi-week high off the indecision doji at 25.60. Above here a cluster of prior highs between 27.00 and 27.70. To the downside, trend support at 24.50 ahead of 20-sma at 24.26 and 23.56.
Silver Daily Price Chart (March – October 22, 2020)
| Change in | Longs | Shorts | OI |
| Daily | 3% | 2% | 3% |
| Weekly | 4% | -9% | 2% |
IG retail trader data show 86.03% of traders are net-long with the ratio of traders long to short at 6.16 to 1. The number of traders net-long is 3.12% lower than yesterday and 7.86% lower from last week, while the number of traders net-short is 15.12% higher than yesterday and 17.39% higher from last week.
We typically take a contrarian view to crowd sentiment, and the fact traders are net-long suggests Silver prices may continue to fall.Yet traders are less net-long than yesterday and compared with last week. Recent changes in sentiment warn that the current Silver price trend may soon reverse higher despite the fact traders remain net-long.
What is your view on Gold andSilver – are you bullish or bearish?? You can let us know via the form at the end of this piece or you can contact the author via Twitter @nickcawley1.


