


DAX 30, FTSE 100, CAC 40 Price Outlook:
- The DAX 30 may be in the process of forming a rising wedge pattern which could see a reversal
- The FTSE 100 and CAC 40 remain in their longer-term channels despite recent turbulence
- What is Earnings Season & What to Look for in Earnings Reports?
DAX 30, FTSE 100, CAC 40 Forecasts for the Week Ahead
European stock indices started the week off higher alongside US equity strength, before both regions saw prices recede in tandem with risk appetite. Still, October has erased much of the losses suffered in September – despite little change to the fundamental landscape. Such a shift in price, without a similar improvement in conditions, is a little worrisome and can make technical formations like a rising wedge more dangerous.
DAX 30 Price Chart: 4 – Hour Time Frame (June 2020 – October 2020)
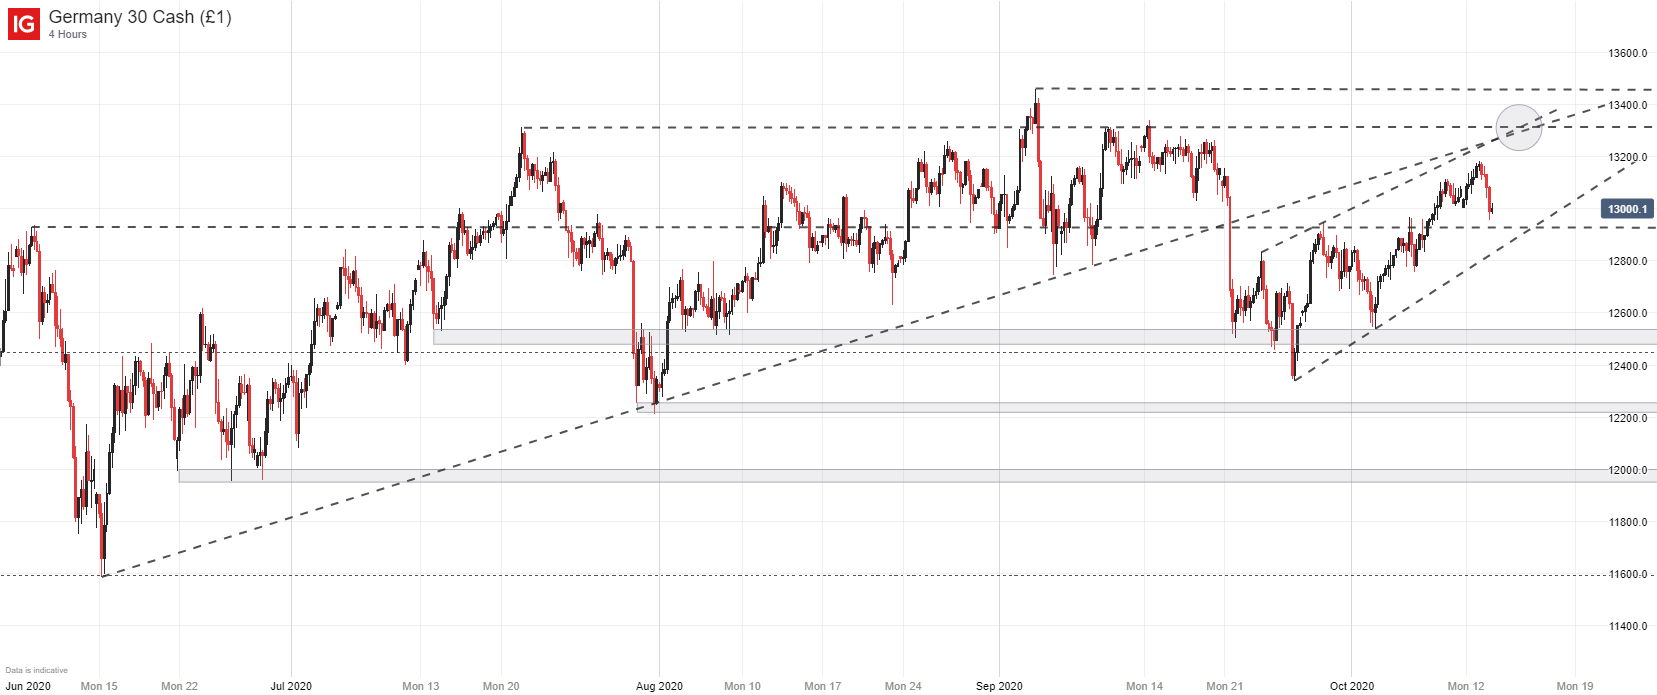
To that end, the DAX 30 appears to be in the midst of such a formation although an ascending channel is another possible resolution to the pattern. Derived from the September lows, the rising wedge has guided price higher ever since. As it climbs, the DAX may encounter resistance around the July peak of 13,310 which has since been joined by two other trendlines. Together, the levels could create an area of significant resistance, further increasing the danger of the bearish technical pattern.

Still, a bearish resolution to the rising wedge would require a catalyst and upcoming event risk is rather insignificant. Since equities have been charging higher with seemingly reckless abandon, it may be presumptuous to suggest a reversal is imminent. That being said, a break beneath support around the 12,925 zone could be an early symptom of a larger reversal.
FTSE 100 Price Outlook
The FTSE 100 has enjoyed a similar rebound this October despite ongoing Brexit uncertainty. Nevertheless, the index’s larger technical formation that has helped drive price lower since June remains intact – suggesting the FTSE 100 could be susceptible to further weakness. Confluent resistance around 6,065 might create a serious barrier for the index, simultaneously opening the door to a potential reversal should price fail to break higher.
FTSE 100 Price Chart: 4 – Hour Time Frame (June 2020 – October 2020)

CAC 40 Price Outlook
Similarly, the CAC 40 remains in the confines of a larger horizontal range spanning from 5,200 to 4,680. In the last few days, however, the French equity index has also formed what seems to be a rising wedge. After turning lower at the 5,000 mark on Tuesday, technicians might view the level as an area of potential resistance going forward.
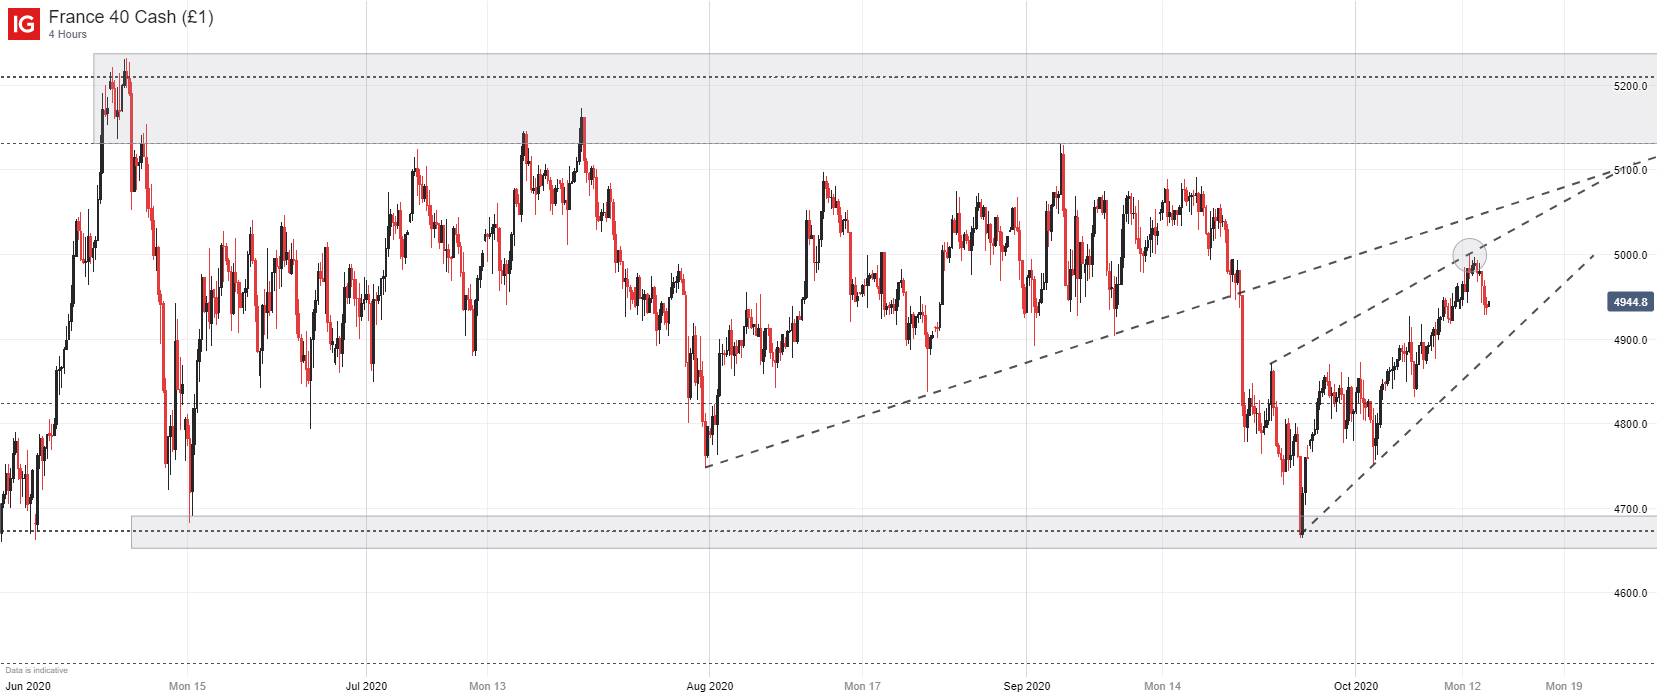
Despite overhead resistance and a potentially bearish technical formation, the CAC 40 finds itself in the position of the DAX 30 where technicals appear to suggest a potential bearish reversal, without a clear catalyst on the fundamental side. Thus, it is difficult to suggest imminent weakness for either the CAC 40 or the DAX 30, although the technical formations create intriguing trade setups. In the meantime, follow @PeterHanksFX on Twitter for updates and analysis.
--Written by Peter Hanks, Strategist for DailyFX.com
Contact and follow Peter on Twitter @PeterHanksFX


