


CRUDE OIL FORECAST: OIL PRICE VOLATILITY AMID SWINGS IN MARKET SENTIMENT CONTAINED BY KEY TECHNICAL LEVELS
- Crude oil price action has recently fluctuated back and forth within a 10% trading range
- Oil prices might revert back lower following a sharp rally that puttered out near the 50-DMA
- Market volatility and trader risk appetite stands to strong-arm the direction of crude oil
Oil prices remain volatile as the sentiment-linked commodity swings aggressively in response to changes in trader risk appetite. Crude oil price action has oscillated back and forth between critical technical support and resistance levels over recent trading sessions amid conflicting bullish and bearish headlines.
For example, fiscal stimulus negotiations, in addition to Trump health updates and election speculation, have largely caused markets to whipsaw. Reports of paused crude oil production in the Gulf of Mexico due to Hurricane Delta likely exacerbated a short-squeeze higher by oil prices, but this seems largely priced in now.

CRUDE OIL PRICE CHART: DAILY TIME FRAME (28 MAY TO 07 OCT 2020)

Chart created by @RichDvorakFX with TradingView
Correspondingly, crude oil price action caught a bid off the $37.00-handle over the prior two trading sessions, which was detailed as an area of buoyancy in our weekly oil forecast. The sharp spike by oil prices propelled the commodity 10% higher above the $40.00-mark, but after failing to reclaim the 50-day moving average, selling pressure has since resumed. This brings the 100-DMA back into focus as a potential support level before the September lows come back into focus as a potential downside objectives for crude oil bears.
| Change in | Longs | Shorts | OI |
| Daily | 3% | -7% | 1% |
| Weekly | 31% | -38% | 7% |
CRUDE OIL PRICE CHART WITH VIX INDEX OVERLAID: 4-HOUR TIME FRAME (24 AUG TO 07 OCT 2020)
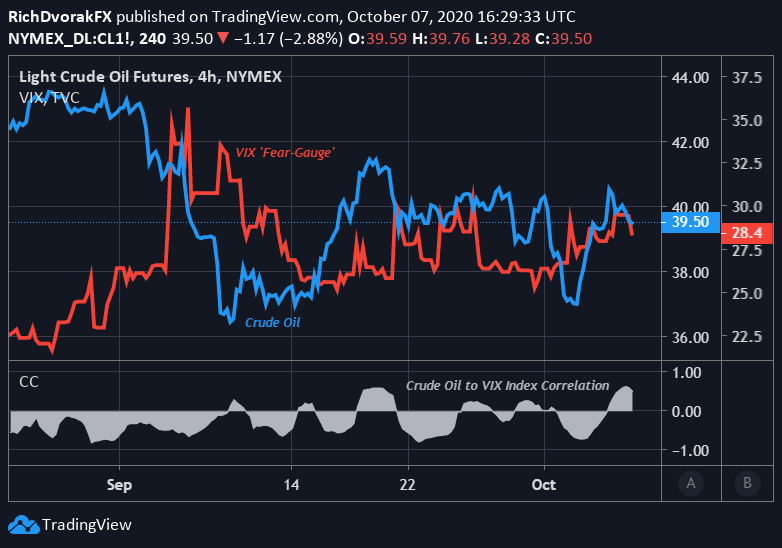
Chart created by @RichDvorakFX with TradingView
That said, oil prices might attempt to edge higher if the S&P 500-derived VIX Index, or fear-gauge, drifts lower. The direction of crude oil generally maintains an inverse relationship with the VIX as illustrated in the chart above. Check out our 4Q-2020 fundamental and technical crude oil forecast for comprehensive insight on where oil prices might head going forward.

-- Written by Rich Dvorak, Analyst for DailyFX.com
Connect with @RichDvorakFX on Twitter for real-time market insight


