


US Presidential Debate, Donald Trump, Joe Biden, US Dollar, S&P 500 – Talking Points:
- The first presidential debate of the 2020 US elections appeared to have little effect on the market, as USD held firm and the S&P 500 nudged marginally higher.
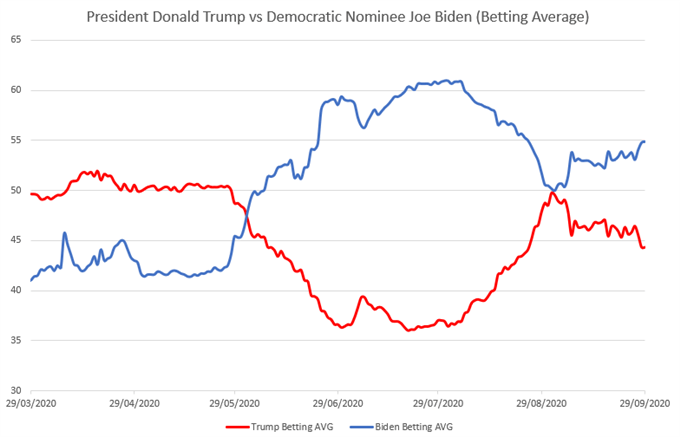
- President Trump’s tax returns may prove to be the target of further attacks from Democratic nominee Joe Biden
First Presidential Debate or Game of Schoolyard Insults?
The first round of the 2020 US presidential debate between Democratic nominee Joe Biden and incumbent President Donald Trump proved to be more of a game of schoolyard insults, as both men continually insulted and talked over one another.
However, Mr Biden’s composure and willingness to poke holes in his Republican counterpart’s response to the Covid-19 crisis could result in a more substantial widening in polling numbers.
In terms of an overall market reaction, the US Dollar slid marginally lower while S&P 500 futures initially rose before giving back all gains towards the end of the debate.
Attention now turns towards the second presidential debate scheduled on October 15, with market participants closely watching Congressional stimulus negotiations in the interim to determine the near-term outlook for risk-sensitive assets.
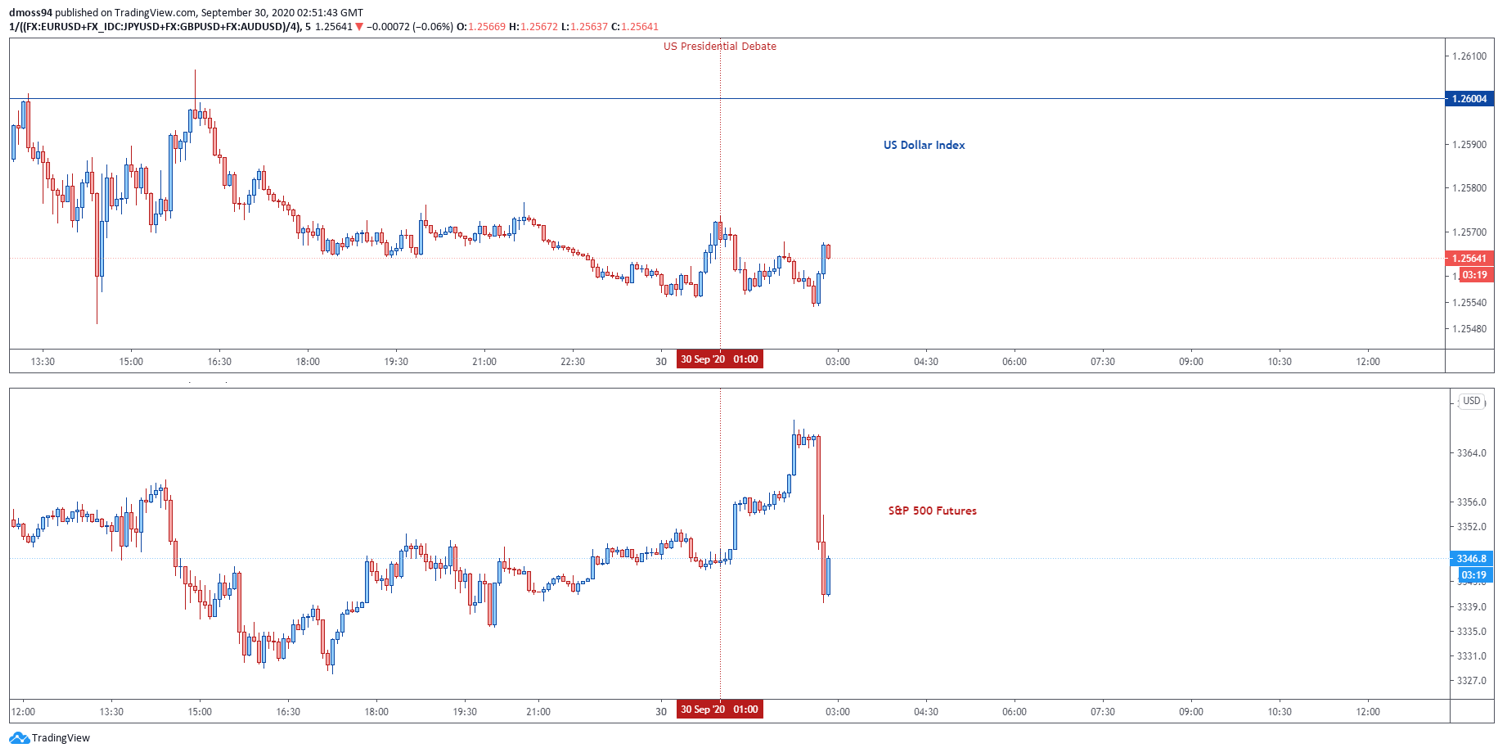
Market reaction chart created using TradingView
Biden Pulling Away as Tax Scandal Hampers Trump Campaign
Democratic nominee Joe Biden appears to have extended his lead over Republican incumbent Donald Trump on the back of questionable tax practices by the current US President, with the New York Times reporting that Trump had paid no income taxes at all in 10 of the previous 15 years.
In fact, the year Trump was elected to the White House, he paid a paltry $750 in federal income taxes.
The damning report threatens to shatter the President’s image as a successful businessman, given that the Internal Revenue Service (IRS) report “portrays a businessman who takes in hundreds of millions of dollars a year yet racks up chronic losses that he aggressively employs to avoid paying taxes”.
Data source – Bloomberg
Clearly Mr Biden sees this as a chink in his competitor’s armour, as the former Vice President strategically released his most recent tax returns just moments before the start of the first presidential debate, showing that he had paid just under $300,000 in income taxes last year.
This release could endear the Democratic nominee to voters by showing that, in comparison to Mr Trump, Biden pays income tax just like every other working-class American.
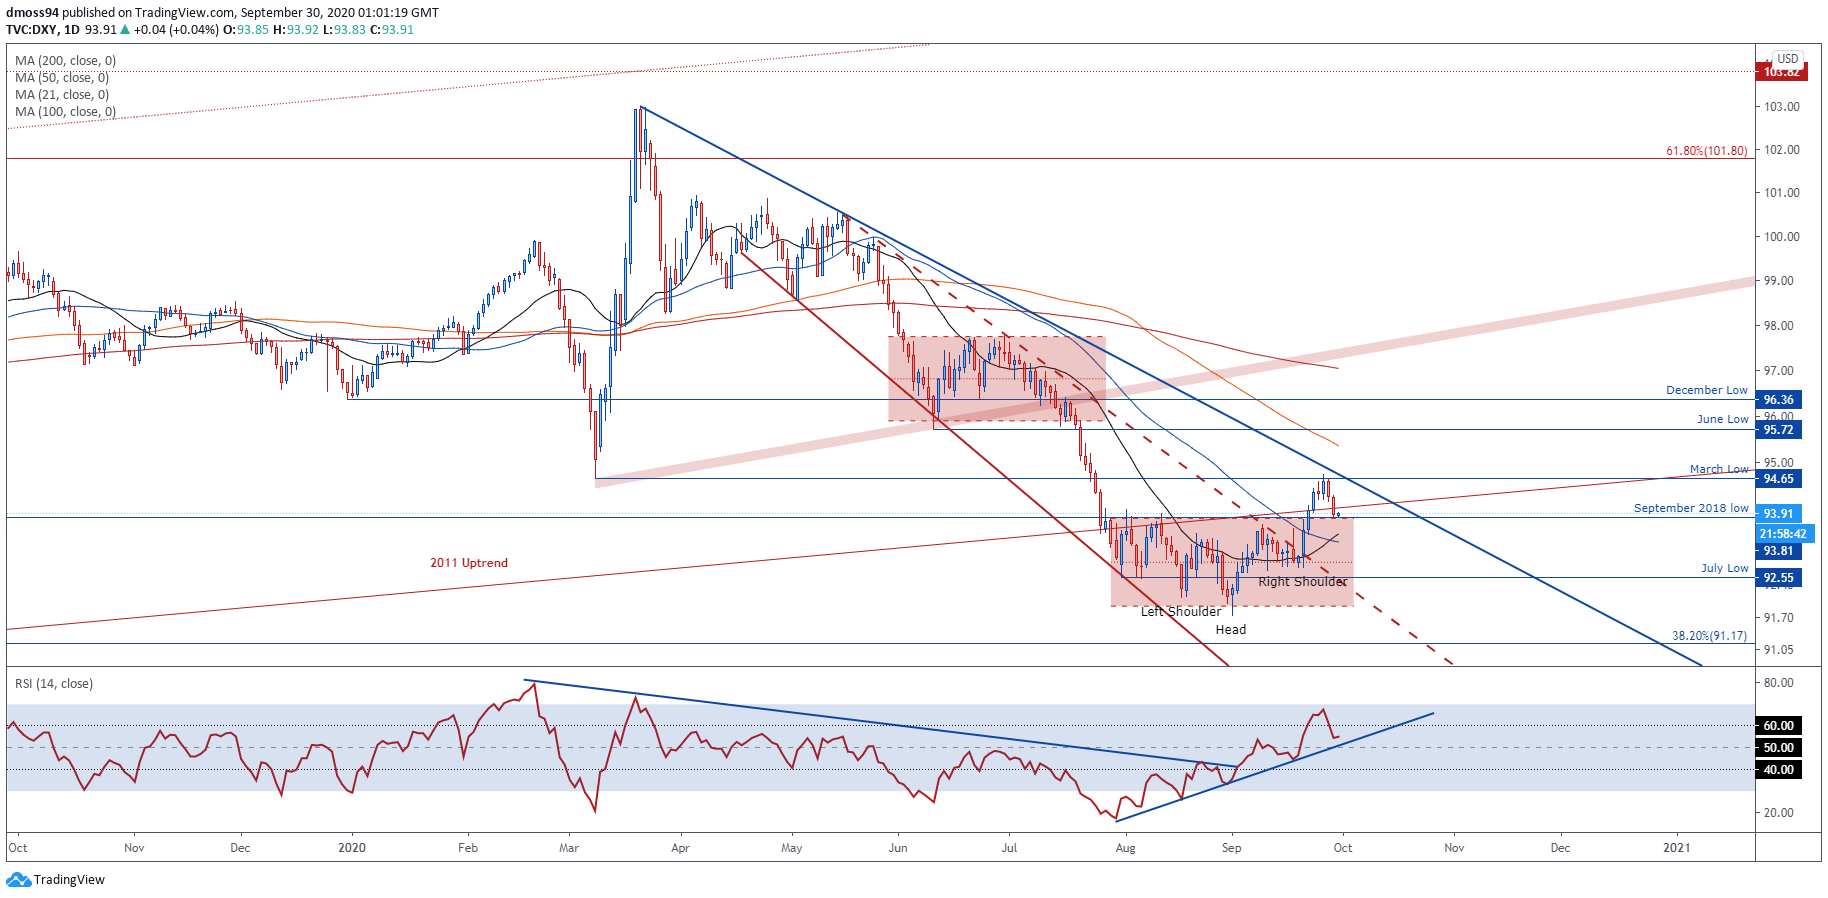
US Dollar Index Daily Chart – Breakdown or Retest of Former Resistance-Turned Support
DXY daily chart created using TradingView
From a technical perspective, the US Dollar Index’s (DXY) retreat from the March low (94.65) back to support at the September 2018 low (93.81) may validate the topside break of an Inverse Head and Shoulders reversal pattern, carved out above key psychological support at the 91.00 level.
Moreover, with the RSI continuing to track along the uptrend extending from the August extremes and hovering above its neutral midpoint, the path of least resistance looks to be higher.
Should support remain intact at the 94.00 mark, a retest of the monthly high (94.74) looks in the offing, with a daily close above the March low (94.65) needed to bring the June low (95.72) into focus.
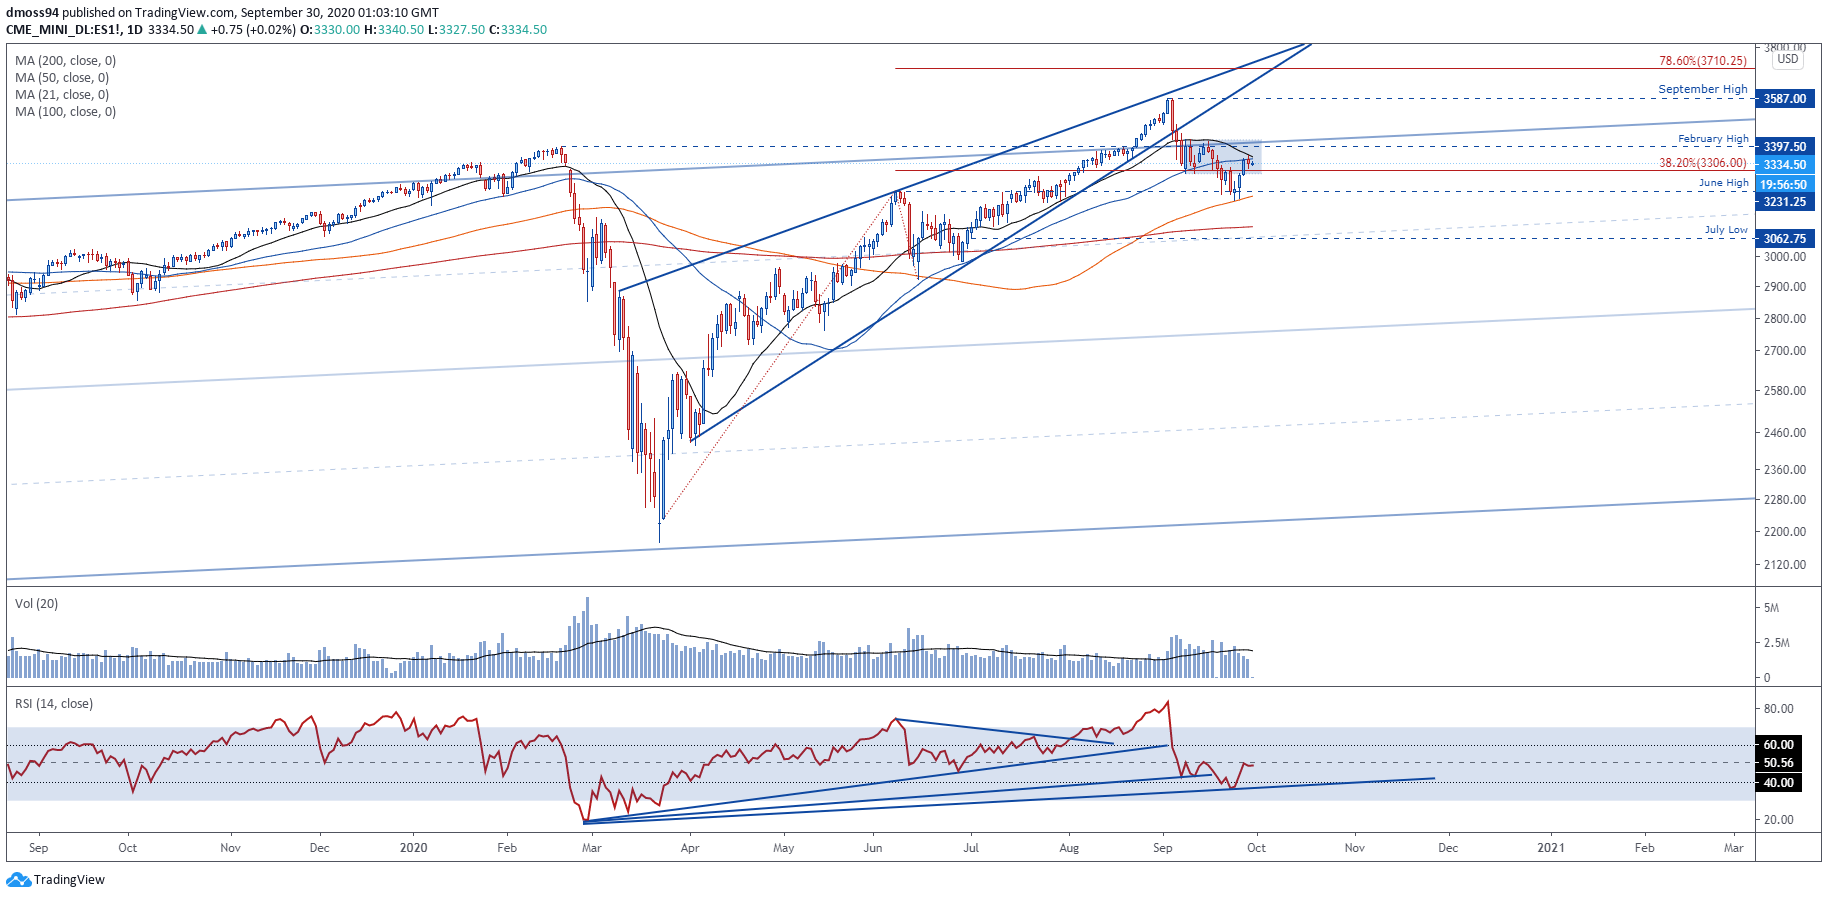
S&P 500 e-Mini Futures Daily Chart – 200-MA Capping Topside Potential
S&P 500 (e-mini) futures daily chart created using TradingView
The US benchmark S&P 500 index looks poised to continue its trek lower, as price fails to break back above the trend-defining 50-day moving average (3351.54) and the RSI struggles to clamber over its neutral midpoint.
With volume notably fading through the S&P 500 index’s rally from the monthly low (3198), the path of least resistance appears skewed to the downside.
To that end, a break back below the 38.2% Fibonacci (3306) would probably ignite a more sustained pullback and potentially lead price back towards the sentiment-defining 200-DMA (3104.21).
| Change in | Longs | Shorts | OI |
| Daily | 1% | -1% | 0% |
| Weekly | 15% | -13% | -1% |
-- Written by Daniel Moss, Analyst for DailyFX
Follow me on Twitter @DanielGMoss


