CAD Analysis and Talking Points
Month-End to Distort Price Action
In the very short term, price action in USD/CAD is likely to be distorted by month-end flows. The general view is that month-end is expected to be USD supportive, in light of the underperformance of US equities throughout September. That said, this is not expected to be long lasting with market participants potentially using the month-end USD positive flows as a chance to reload their bearish view on the greenback. That said, the Canadian Dollar has issues of its own with a second wave of COVID cases across Canada becoming very apparent. Elsewhere, yesterday’s crash in oil prices is another cause of concern for the Loonie and with the weak dynamics in the oil complex regarding demand, oil prices may continue to head lower.
On the economic calendar, Canadian GDP for July will be announced, however, my view is that this will unlikely be a notable mover for the Loonie and thus, external factors are more at work for price action. Statistics Canada real GDP tracker signalled last month that growth in July likely rose 3%, reaffirming the strong rebound view in Q3 growth.
USD/CAD Key Resistance Ahead
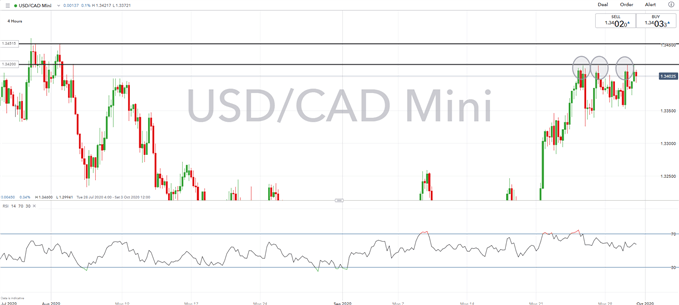
On the topside, further gains in USD/CAD has struggled at 1.3420 on multiple occasions. If indeed, month-end flows manage to see USD/CAD break above resistance, this can open the doors to 1.3440-50. Meanwhile, 1.3350 has remained key for defending pullbacks in the pair, which also marks the weekly lows, while 1.3330 is the next level below.
| Change in | Longs | Shorts | OI |
| Daily | -2% | 7% | 5% |
| Weekly | -30% | 38% | 13% |
Canadian Dollar Technical Levels
| Support | Resistance | ||
|---|---|---|---|
| 1.3350 | Weekly Low | 1.3420 | - |
| 1.3330 | - | 1.3442 | 100DMA |
| 1.3300 | 1.3526 | 200DMA |
DailyFX Economic Data and Events Calendar
USD/CAD Price Chart: 4-Hour Time Frame

Source: IG Charts


