


DJI PRICE OUTLOOK: DOW JONES INDUSTRIAL AVERAGE CLAWS BACK LOSSES ON UPBEAT CONSUMER SENTIMENT REPORT
- Dow Jones pivots higher with the S&P 500 and Nasdaq owing to consumer sentiment data
- Consumer sentiment data for September showed improvement and topped forecast
- Stocks attempt to turn positive and claw back recent downside after holding weekly lows
Equities are erasing early session losses as major stock indices like the Dow Jones, S&P 500 and Nasdaq turn positive shortly following the New York opening bell. The release of preliminary consumer sentiment data for September from the University of Michigan crossing the wires just now may be contributing to the recovery in risk appetite.

CONSUMER SENTIMENT REPORT - UNIVERSITY OF MICHIGAN SURVEY OF CONSUMERS (SEP 2020)

Chart Source: DailyFX Economic Calendar
Headline consumer sentiment was reported at 78.9, which topped market forecast of 75.0 and improved from 74.1 the prior month. The improvement in consumer sentiment was attributed to their slightly rosier outlook for the US economy.
| Change in | Longs | Shorts | OI |
| Daily | -4% | 0% | -1% |
| Weekly | -18% | 8% | -1% |
DOW JONES PRICE CHART: 1-MINUTE TIME FRAME (17 SEP TO 18 SEP 2020)
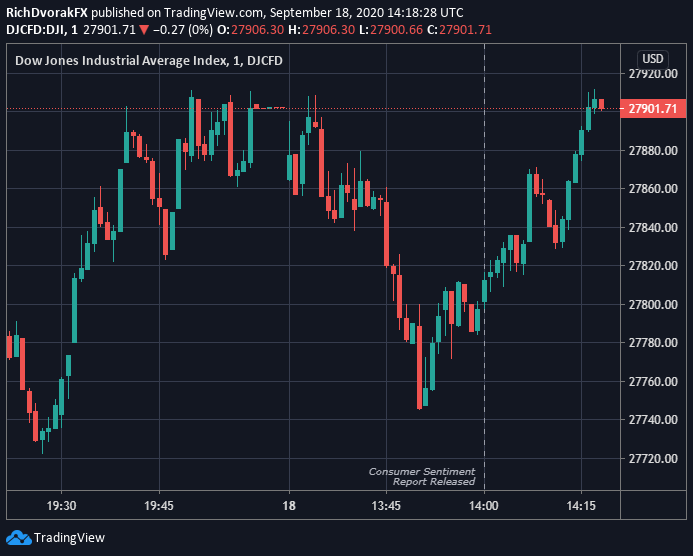
Chart created by @RichDvorakFX with TradingView
As mentioned, it is likely that stocks are advancing on the back of the upbeat consumer sentiment report. DJIA price action has faced selling pressure over recent trading sessions, but the equity benchmark has maintained weekly lows as dip buyers defend key technical levels. With market volatility on the rise, however, stocks could struggle to remain in favor.
Keep Reading: Crude Oil Price Climbs to Test 50-DMA in Wake of OPEC+ Update
-- Written by Rich Dvorak, Analyst for DailyFX.com
Connect with @RichDvorakFX on Twitter for real-time market insight


