


Silver Price Analysis
- Depressed volatility echoes in silver price chart.
- Symmetrical triangle may prompt further upside.
- IG Client Sentiment Index (IGCS) points towards short-term downside.
Visit the DailyFX Educational Center to discover more technical tools to enhance your trading!
Silver Holding Steady as Price Converges Within a Basic Symmetrical Triangle
After August highs, spot silver has somewhat consolidated tracking its precious metal counterpart, gold. This lateral move in price action comes after the US Dollar halted rapid declines since March. Furthermore, silver volatility has decreased (see chart below) since August highs which roughly overlays with the sideways movement in XAG/USD. While silver prices have ignored the traditional positive linear relationship with volatility during a short period in early August, this relationship seems to have resumed as prices have fallen with volatility.
CBOE Silver ETF Volatility Index (VXSLV): 3-Month Chart
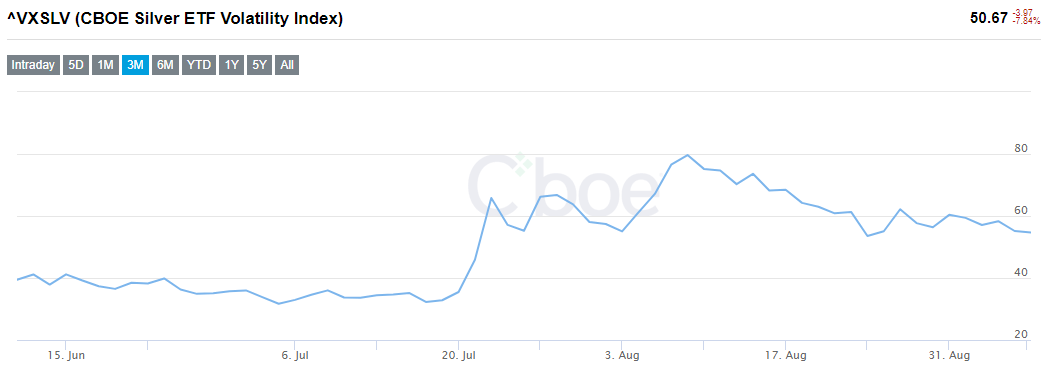
Source: CBOE
Silver Technical Analysis: Daily Chart
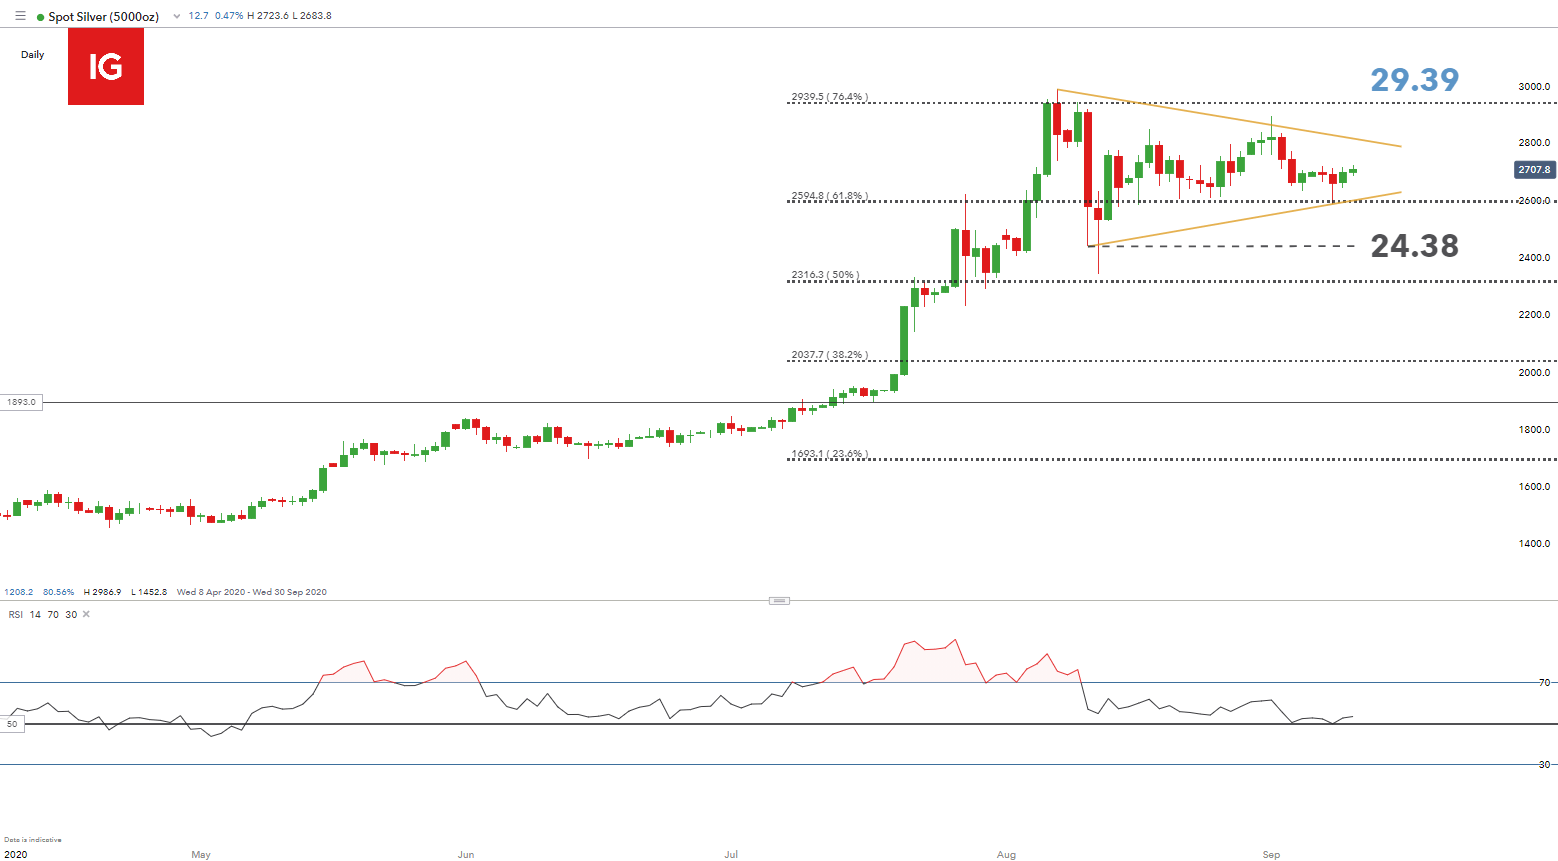
Chart prepared by Warren Venketas, IG
Technically, the daily chart shows a basic symmetrical triangle formation (yellow) after silver’s strong uptrend from July. As the price range continues to contract a breakout is likely to occur. Symmetrical triangles may break either up or down however, technical analysts generally tend to favor a continuation of the preceding trend which would point to further upside in this case.
Price is currently trading around the 27.00 psychological level (at the time of writing) which may extend higher to topside resistance (yellow). If the triangle pattern pushes above trendline resistance, the 29.39 horizontal level could be established as subsequent resistance.
The Relative Strength Index (RSI) remains slightly bullish above the 50 level. The 50 RSI level has not been breached below since May this year which may suggest price may bounce off the 50 support and continue its medium-term bullish momentum.
From the bearish perspective, the 25.94 61.8% Fibonacci level has proven to be a key level of near term support - Fibonacci levels taken from April 2011 high to March 2020 low. A break below 25.94 may signal a trend reversal to recent swing lows (24.38).
Dollar Index Price Technical Analysis: Weekly Chart
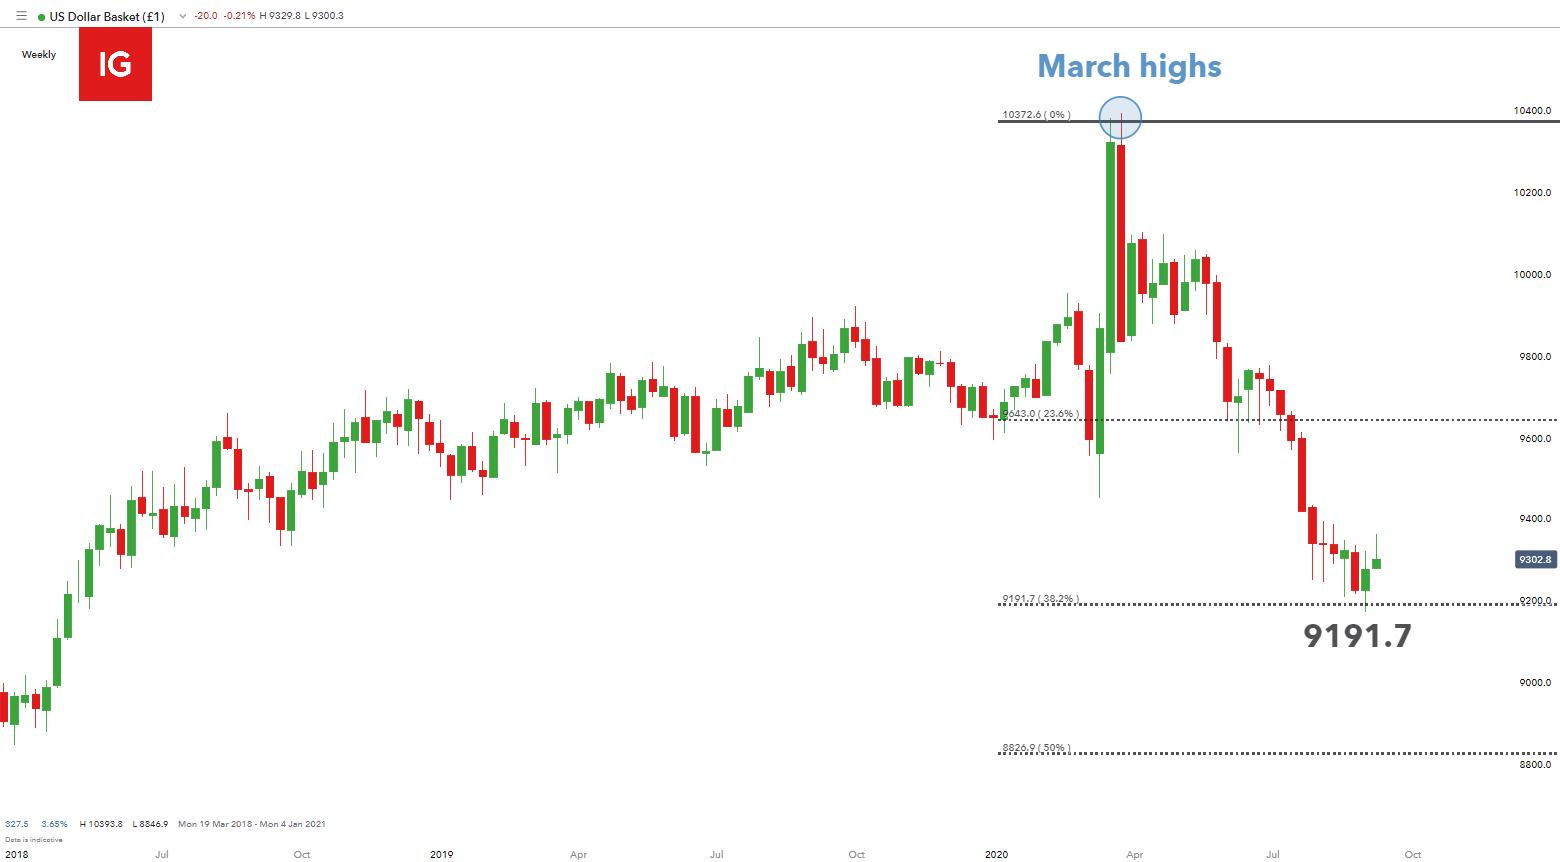
Chart prepared by Warren Venketas, IG
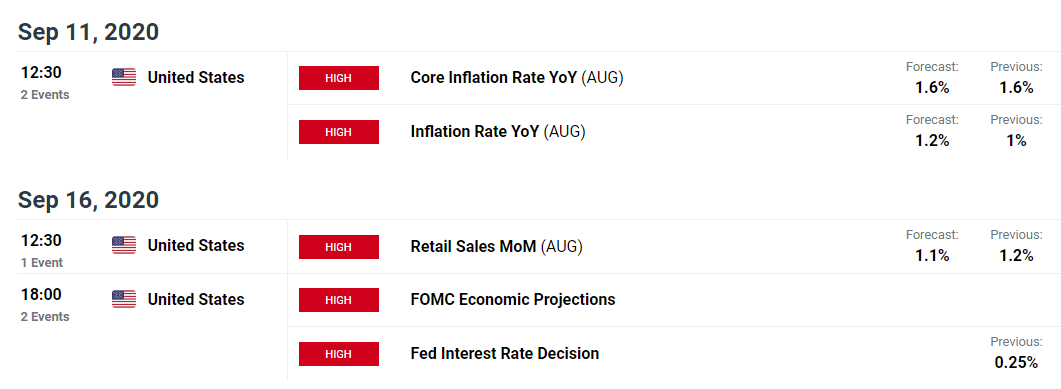
The US Dollar Index (DXY) has recently shown some resolve around the 9191.7 38.2% Fibonacci support zone. Although short-term USD strength is apparent, it is difficult to ignore the aggressive preceding and still self-assured downtrend. There would need to be far more upside before a reversal is confirmed. Upcoming US Dollar related events may have systemic effects on the precious metal which may be witnessed during the high impact events on the DailyFX economic calendar below:

Silver Stratergy Moving Forward
Taking into account the traditional inverse relationship between silver and the USD, the outcome of the symmetrical triangle may be decided by the US Dollar. Global market sentiment cannot be ignored either as the COVID-19 pandemic continues to influence risk appetite. Interest rate decisions and economic policies will also factor into the future of silver price action so keeping up to date with economic enouncements is important.
Key trading points to consider:
- Silver volatility
- Symmetrical triangle breakout
- Technical indicators – RSI 50 level
- US Dollar and future economic events
- IGCS data
IG Client Sentiment Data Points to Near Term Bearish Bias
| Change in | Longs | Shorts | OI |
| Daily | 3% | 2% | 3% |
| Weekly | 4% | -9% | 2% |
IGCS shows retail traders are currently significantly long on Silver, with 87% of traders currently holding long positions (as of this writing). At DailyFX we typically take a contrarian view to crowd sentiment, and the fact traders are net-long is suggestive of a short-term price move to the downside.
--- Written by Warren Venketas for DailyFX.com
Contact and follow Warren on Twitter: @WVenketas


