


Australian Dollar, AUD/USD, AUD/JPY, Reopening Roadmap, RBA – Talking Points:
- The extension of Covid-19 lockdown measures in Australia’s second most populous state could severely hamper the nation’s nascent economic recovery.
- The Reserve Bank of Australia’s wait-and-see approach to monetary policy may continue to underpin AUD.
- AUD/JPY poised to extend climb after validating topside break of Ascending Triangle pattern.
- Ascending Channel guiding AUD/USD rates higher.
Extended Covid-19 Lockdown Measures Hampering Economic Recovery
The decision by Premier Dan Andrews to extend stage-four restrictions in Melbourne, Australia’s second largest city, could hamper the nation’s nascent economic recover and limit the potential upside for the local currency.
Andrews’ proposed “reopening roadmap” implies that Victoria, Australia’s second most populous state, would only completely emerge from coronavirus-enforced restrictions on November 23, if the region is able to record no new infections “for the two weeks prior”.
This extremely conservative approach has been called into question by Prime Minister Scott Morrison, stating that “what I can’t help but be struck by is that, under the thresholds that have been set in that plan, Sydney would be under curfew now”.
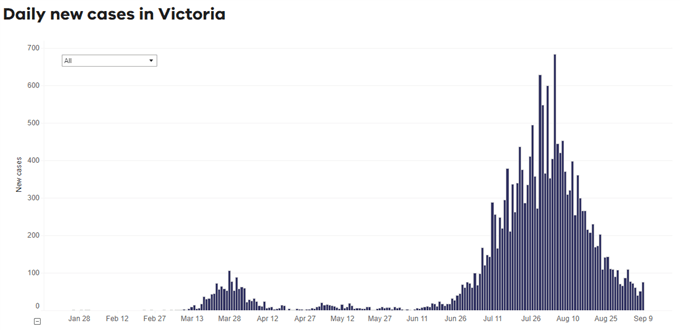
Source – DHHS Victoria
Morrison’s condemnation of the Premier’s roadmap seems understandable given the economic impact of extended lockdown measures on a state that accounts for “about a quarter of the national economy”, according to Treasurer Josh Frydenberg.
Therefore, with current restrictions estimated to cost the local government more than $1 billion a week and the Victorian unemployment rate prior to the drastic tightening of restrictions hovering just shy of 7%, the number of daily case numbers may dictate the near-term outlook for regional risk assets.
A drawn-out easing process will probably weigh on the performance of the benchmark ASX 200 index and Australian Dollar.
Wait-and-See RBA Underpinning AUD
The Reserve Bank of Australia’s wait-and-see approach to monetary policy has seemingly put a floor under the local currency against its major counterparts, as policymakers dismiss the potential implementation of a negative interest policy and opt to keep the official cash rate at its effective lower bound of 0.25%.
However, the suggestion that “the Board will maintain highly accommodative settings as long as is required and continues to consider how further monetary measures could support the recovery” could indicate that the RBA is looking to build on its decision “to increase the size of the Term Funding Facility and make the facility available for longer”.
What those “further monetary measures” may look like is relatively unknown given the central bank already utilizes yield curve control (YCC) and has been openly dismissive of the effectiveness of foreign exchange intervention.
Westpac Consumer Confidence Index (2015-2020)
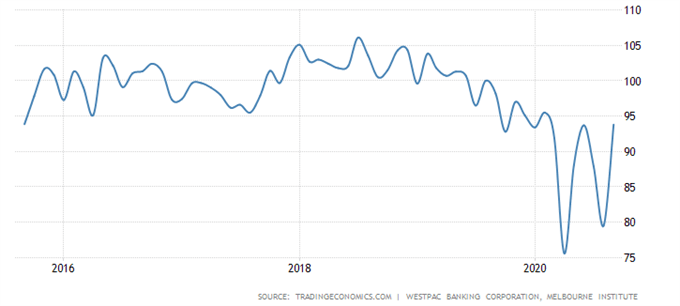
Source – Trading Economics
Moreover, recent economic data suggests that the provision of additional monetary stimulus may not be necessary, as the Westpac Consumer Confidence Index jumped from 79.5 to 93.8 in September and the current account for the second quarter expanded to $17.7B – exceeding the expected $13B surplus.
Nevertheless, with second quarter GDP figures showing the local economy contracted more than the RBA estimated in its August Statement on Monetary Policy, policymakers may be compelled to act amid extended Victorian lockdown measures.
With that in mind, the central bank’s upcoming minutes from its September meeting could limit the potential upside for AUD, if policymakers flag the provision of further stimulus at their upcoming meeting on October 6.
AUD/JPY Daily Chart – 21-DMA Guiding Price Higher
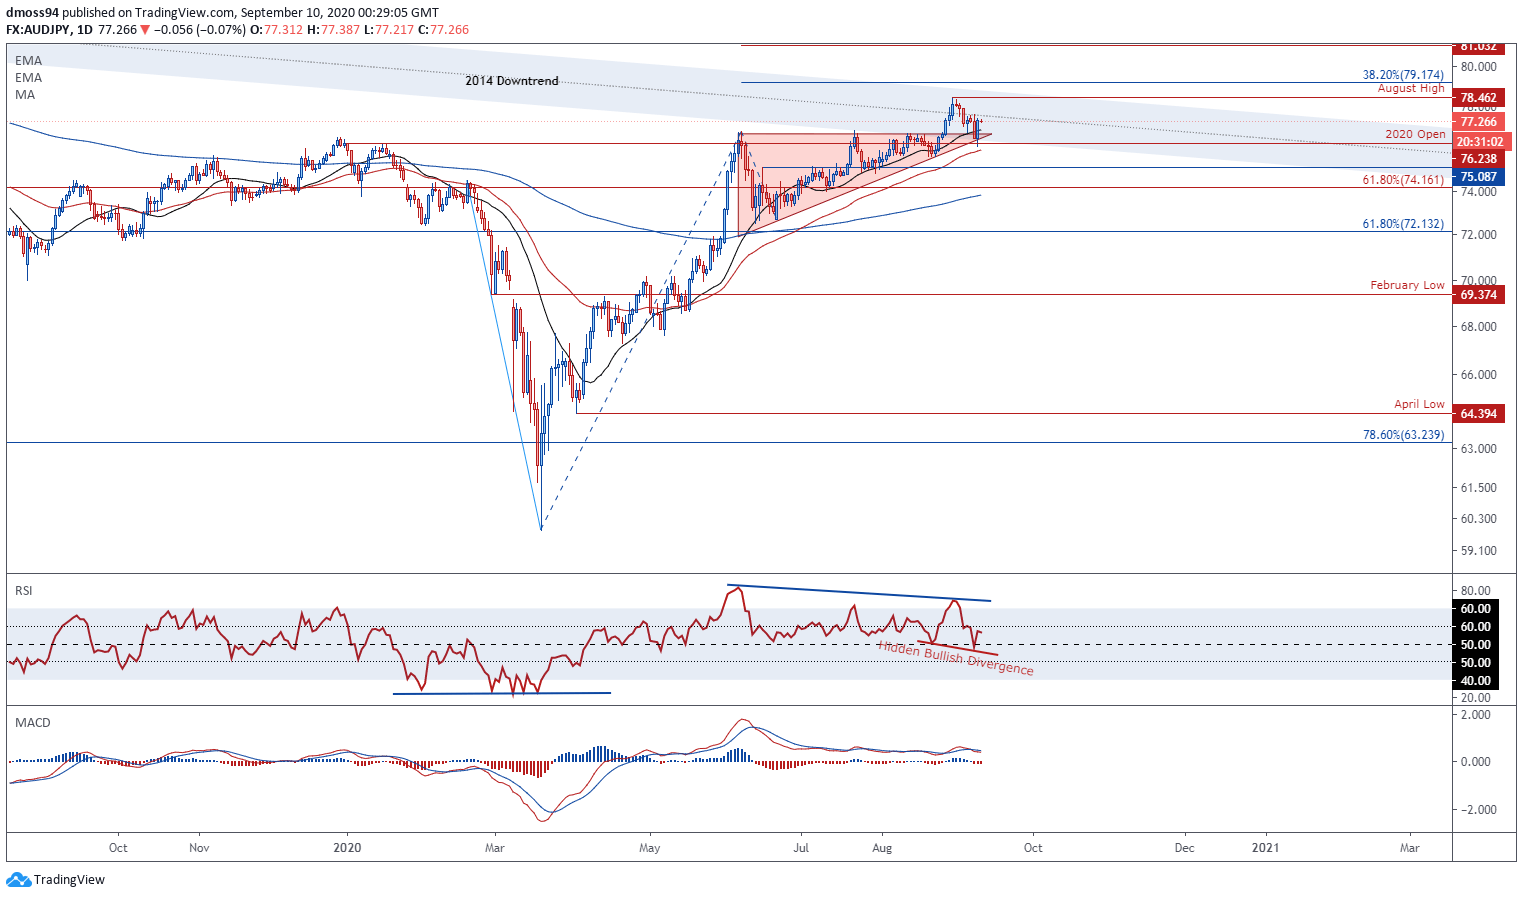
AUD/JPY daily chart created using TradingView
Although AUD/JPY rates have notably retreated from the yearly high set on August 31 (78.46), price failed to close back below confluent support at the 2020 open (76.23) and Ascending Triangle hypotenuse.
This suggests that the recent decline may be a counter-trend correction and could have validated the topside break of the bullish continuation pattern, as price accelerates back above the 21-day moving average (76.90).
Furthermore, hidden bullish RSI divergence is indicative of swelling buying pressure, which could generate a push back to test the August high (78.46) if price remains constructively perched above key support at the psychologically pivotal 77 level.
A daily close above the August high is needed to signal the resumption of the primary uptrend and bring the Ascending Triangle’s implied measured move (81.03) into play.
| Change in | Longs | Shorts | OI |
| Daily | 0% | 11% | 5% |
| Weekly | 29% | -25% | -3% |
AUD/USD Daily Chart – Hidden Bullish Divergence Hints at Extended Gains
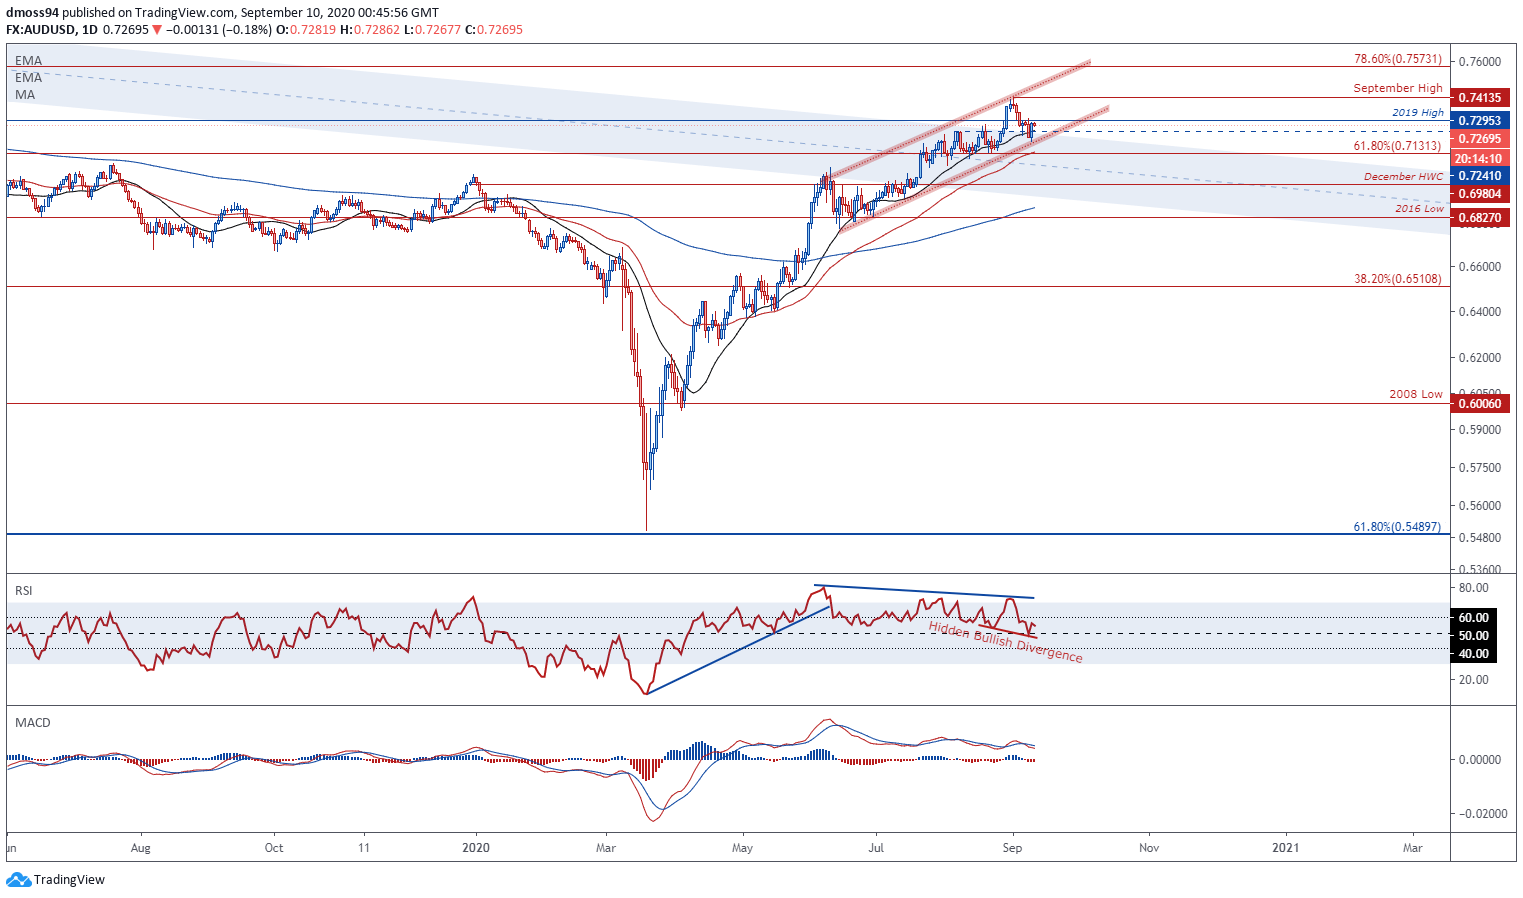
AUD/USD daily chart created using TradingView
Much like its AUD/JPY counterpart, AUD/USD appears to be gearing up to continue its climb towards the 78.6% Fibonacci (0.7573) after bouncing off Ascending Channel support and closing back above the August 5 swing-high (0.7241).
The 21-day moving average may continue to guide price higher -as it has done for much of the AUD/USD exchange rate’s climb from the yearly low (0.5506) - as hidden bullish divergence seen on the RSI hints at swelling bullish momentum.
A daily close above the 2019 high (0.7295) would probably generate a push back towards the monthly high (0.7413), with a break above bringing the psychologically imposing 75 level into focus.
| Change in | Longs | Shorts | OI |
| Daily | 2% | 3% | 2% |
| Weekly | 29% | -46% | 0% |
-- Written by Daniel Moss, Analyst for DailyFX
Follow me on Twitter @DanielGMoss


