


Talking Points:
- Divergences Occur When Prices Separate From an Indicator
- Traditional Divergence May Help Pinpoint Market Reversals
- Hidden Divergence May Help Pinpoint Market Retracements
At first glance, traders may be inclined to use oscillators, such as RSI and MACD, only for their crossovers and over overbought / oversold levels. These points can be useful, however traders should not neglect identifying indicator divergence as well. Divergence is the separation of price action from an indicator, and help traders identify potential turns in the market.
The first type of divergence is traditional divergence. In an uptrend, traditional divergence is identified when markets are making higher highs, but an indicator is making lower highs. An excellent example is the Gold daily chart below. First the market made a series of higher highs to Golds peak of $1,375.12. However at the same time, the MACD indicator below was trending lower. Traders aware of this divergence had the ability to adjust their risk appropriately, or plan for new downtrend entries with the newly emerging trend.
Gold Price Daily Chart a& MACD Divergence
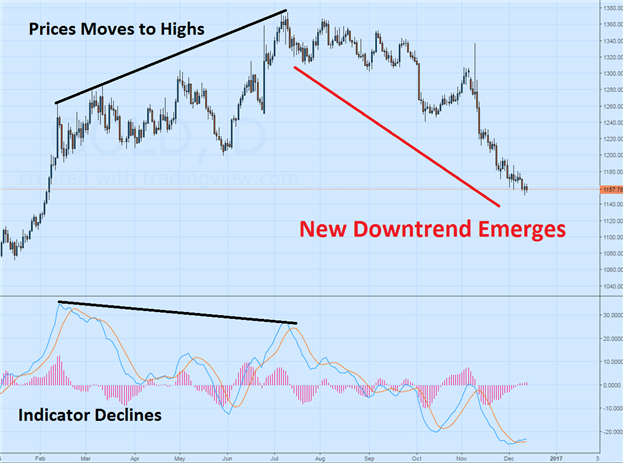
(Created Using TradingView Charts)
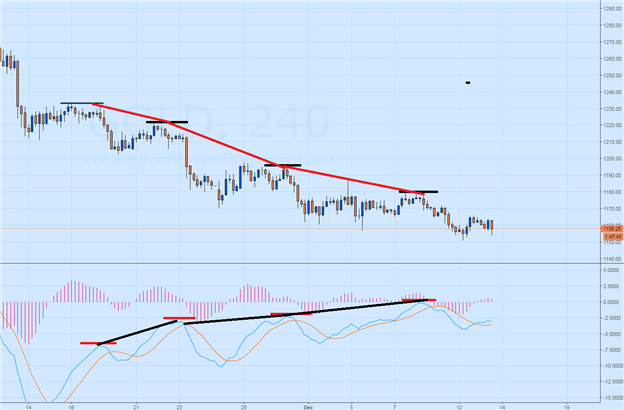
The second type of divergence is called hidden divergence. The reasoning for this is because divergences can be found in an ongoing trend. In the 2Hour chart below, we can see Gold Prices trending downward with the creation of a series of lower highs. At the same point, MACD is trending higher with a series of higher highs. These hidden divergences can be useful to help traders pinpoint retracements within the trend. Potential entry signals may include traditional indicator crossovers, or fresh breakouts with the trend.
Gold Price 2Hour Chart & MACD Hidden Divergence
As traders approach divergence trading for the first time, it is important to remember that markets may diverge for extended periods of time. That is why trading divergences should always be coupled with a developed risk management plan.


