


Australian Dollar, AUD/USD, Iron Ore, RBA Meeting Minutes – Talking Points:
- Falling Covid-19 case numbers in Australia’s second most populous state may buoy regional risk assets
- Soaring iron ore prices underpinning the commodity-linked Australian Dollar
- AUD/USD rates eyeing fresh yearly high despite recent pullback
The Australian Dollar looks set to continue outperforming its major counterparts on the back of falling Covid-19 case numbers in Victoria, Australia’s second-most populous state, as well as surging commodity prices and the Reserve Bank of Australia’s wait-and-see approach to monetary policy.
Tapering Covid-19 Case Numbers Buoying Sentiment
Victoria appears to be “going in the right direction” in its battle against the highly infectious coronavirus, according to Chief Health Officer Brett Sutton, as the state recorded its lowest daily case increase in more than five weeks on August 19.
After peaking on August 2, at 516 cases, the 7-day moving average tracking infections has steadily declined over the last few weeks, reflecting the impact of mandatory mask-wearing and enhanced restrictions on getting the outbreak under control.
More importantly, the virus’ growth rate remains below 1, which means that the number of coronavirus cases may continue to decline. One person infected with the disease is expected to infect, on average, less than one other individual.
Given Victoria accounts for “about a quarter of the national economy”, according to Treasurer Josh Frydenberg, the significant decline in case numbers will likely buoy regional equity prices and the Australian
Dollar, as it becomes less likely that stage-four measures will run past the scheduled September 13 end date.

Source – Covid19Data
Roaring Iron Ore Prices Underpinning AUD
Surging iron ore prices may also be contributing to the commodity-linked Australian Dollar’s climb from the March lows. This is not surprising given Australia has the world’s largest estimated reserves of iron ore.
The price of the metallic rock has climbed over 50% from its April low, as Chinese steel production surged to its highest monthly volume on record and imports climbed over 24% year-on-year in July.
Given this surge in demand, it’s possible that ore prices may extend their recent climb as global manufacturing sectors continue to rebound amid easing coronavirus restrictions.
Therefore, the price of Australia’s most valuable export may serve to underpin the local currency against its major counterparts and could help the AUD/USD exchange rate in its attempt to push to multi-year highs.
Iron Ore Daily Chart – Reversal or Extension?

Iron ore daily chart created using IG
From a technical perspective, iron ore prices are at risk of a reversal to the downside despite breaking above key resistance at the 2019 high (858.5).
The RSI is struggling to follow price to higher highs as it flops just prior to overbought territory, which is indicative of an uptrend running out of steam.
With that in mind, a short-term pullback could be in the offing if price fails to hold above the 2019 high and could see iron ore slide back towards the sentiment-defining 200-day moving average (776.6).
Conversely, a resumption of the primary uptrend would probably eventuate if the RSI does succeed in climbing into overbought territory and could see price surge towards the psychologically pivotal 900 level.
A marked appreciation in the price of the metallic-ore potentially igniting an impulsive topside move in AUD/USD rates.
AUD/USD Daily Chart – Eyeing 2019 High
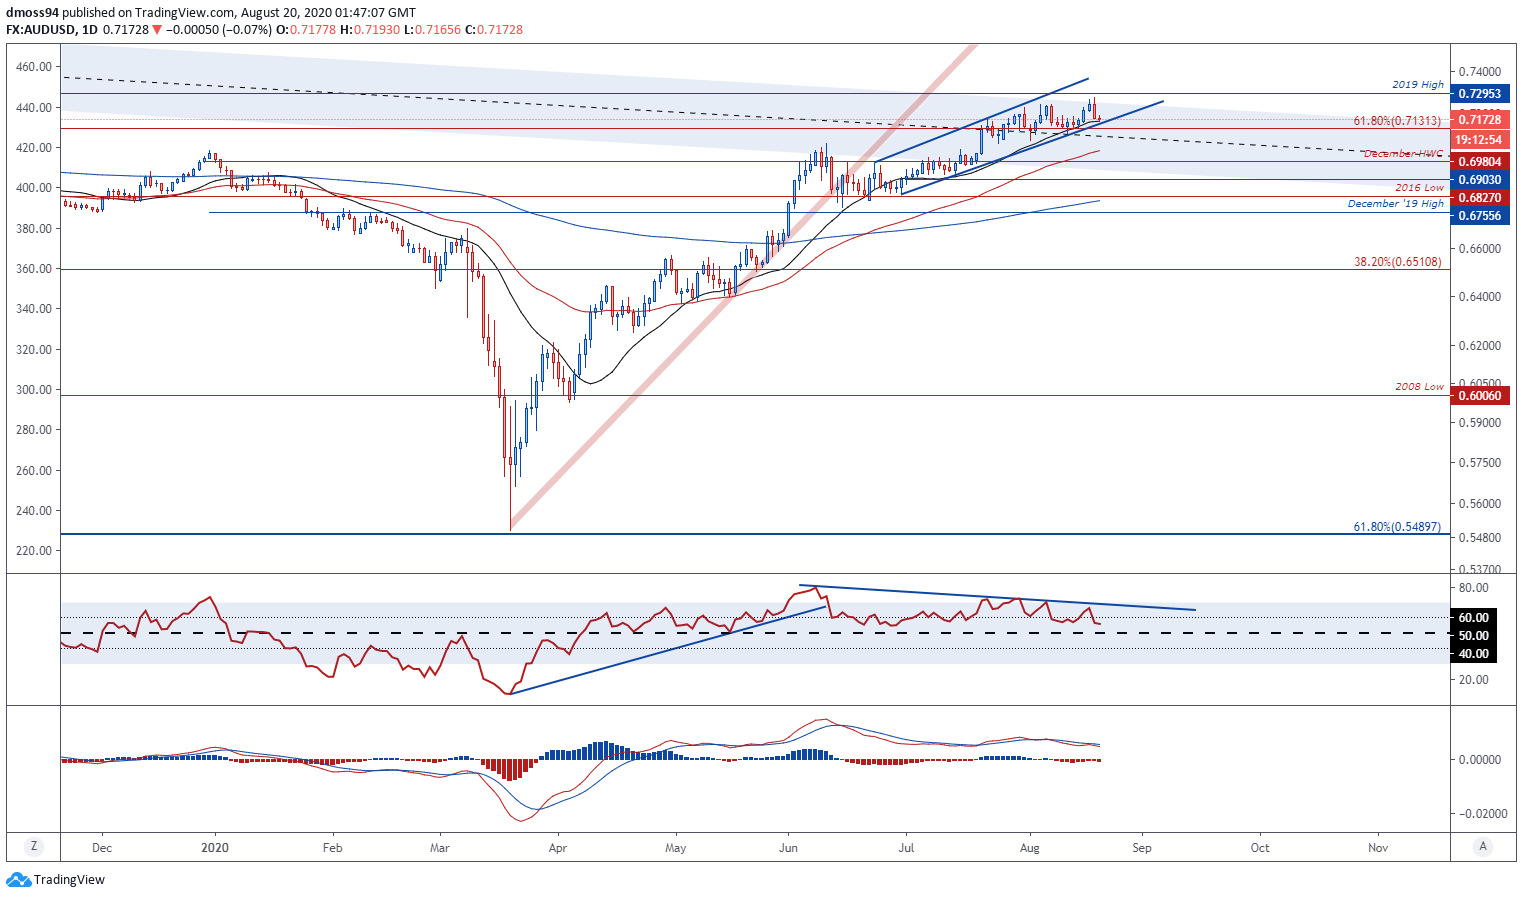
AUD/USD daily chart created using TradingView
Although the AUD/USD exchange rate has struggled to overcome the 2019 high (0.7295) in recent days, it appears the path of least resistance remains to the topside as price continues to track in an Ascending Channel.
The slopes of all three moving averages are indicative of swelling bullish momentum and may encourage further buying pressure, if support at the 61.8% Fibonacci (0.7131) remains intact.
A daily close above the August high (0.7276) is needed to validate upside potential and carve a path to multi-year highs.
On the other hand, a break and close below the psychologically pivotal 71 level may invigorate sellers and result in a significant pullback to the sentiment-defining 200-DMA (0.6808)
| Change in | Longs | Shorts | OI |
| Daily | -1% | -14% | -4% |
| Weekly | 15% | -24% | 5% |
-- Written by Daniel Moss, Analyst for DailyFX
Follow me on Twitter @DanielGMoss


