


DAX 30, S&P 500, NIKKEI 225 INDEX OUTLOOK:
- DAX 30 may lead Asia-Pacific stocks higher. Today’s EU GDP figure is in focus
- S&P 500 index may rise after the holiday break, as the VIX volatility index falls
- Japan’s Nikkei 225 index may attempt to challenge resistance at 23,300 again
DAX 30Index Outlook:
European stocks shrugged off a sharp decline seen last week, ending impressively higher on Monday while the US markets closed for Labor Day holiday. Germany’s DAX 30 and UK’s FTSE 100 index surged 2.01% and 2.39% respectively. This might lead Asia-Pacific stock indices higher, including the Nikkei 225, Hang Seng Index (HSI), and Straits Times Index (STI).
On the macro front, the market foresees Eurozone’s 2Q GDPto have declined at an annualized pace of 15% in the second quarter - its deepest contraction seen in more than two decades. This expectation, however, has largely been priced in the currency and stock markets. A large deviation from the consensus will, however, likely see volatility spike in the Euro and DAX 30 later today.

Yesterday’s China trade balance data also gave market sentiment a boost as export growth hit 9.5% YoY in August, a level not seen since March 2019. Imports fell 2.1% from a year ago, but still marked a great improvement from the double digit declines seen in April to May 2020.
Sector-wise, all eleven DAX 30 sectors ended higher. The rally was led by information technology (+3.03%), real estate (+2.75%), consumer discretionary (+2.38%) and materials (+2.37%) – a clear “risk on” pattern.
Euro Area Gross Domestic Product YoY (Forecast)
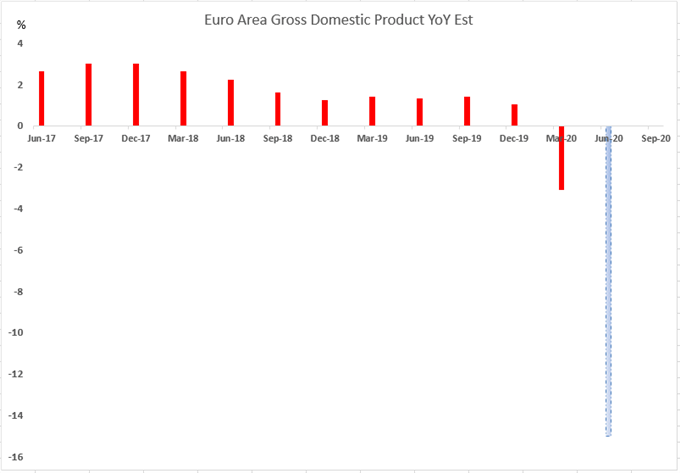
Source: Bloomberg, DailyFX
Technically,the selloff seen last week didn’t seem to have derailed DAX’s upward trajectory. The index remained in a bullish trend with its 20-, 50-, and 100-Day Simple Moving Average (SMA) lines sloping upwards. An immediate support level can be found at 12,880 (50-Day SMA). Breaking the 50-Day SMA will likely lead to further consolidation towards the 76.4% Fibonacci retracement level at 12,450 (chart below).
DAX 30 – Daily Chart

S&P 500 Index Outlook:
The S&P 500 index looks set to rebound from Friday’s losses, as traders return from holiday with a refreshed mood. A lower-than-expected unemployment rate alongside a decent non-farm payrollincrease is likely to underpin the mid-term recovery story. An improved fundamental outlook, as suggested by recent job and PMI data, is likely to send the US Dollar higher and limit the depth of the stock market selloff.
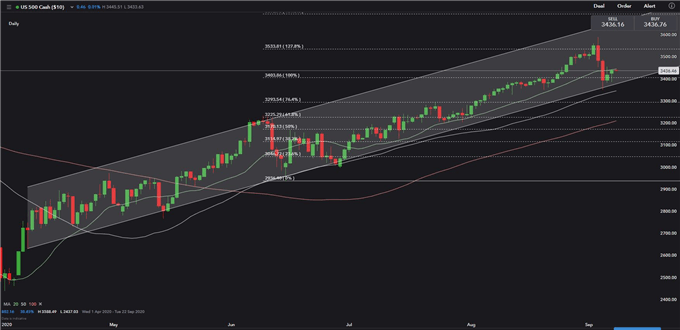
Technically, the S&P 500 index suffered a technical correction of a magnitude of 6.5% last week. The index, however, still remained within its “Ascending Channel” as shown in the chart below. The technical pullback might again serve as a healthy correction within a mid-term bull market. Immediate support levels can be found at 3,400 (100% Fibonacci extension) and then 3,345 (50-Day SMA).
S&P 500 Index – Daily Chart
NIKKEI 225 Index Outlook:
Technically, the Nikkei 225 index is challenging resistance at 23,300, which has been tested a few times without a meaningful breakthrough. Failing to break this level again will probably see a pullback towards immediate support levels at 22,800 (50-Day SMA) and then 22,400 (100-Day SMA).
NIKKEI 225 Index – Daily Chart


--- Written by Margaret Yang, Strategist for DailyFX.com
To contact Margaret, use the Comments section below or @margaretyjy on Twitter


