


Copper Prices, XCU/USD, Commodities – Talking Points:
- Copper prices appear poised to climb higher amid a positive fundamental backdrop and bullish technical setups.
- Symmetrical Triangle break could fuel push to multi-year highs.
Copper’s 56% surge from the March low is showing little signs of abating, after the price of the ductile metal soared to a fresh two-year high (3.0945) at the beginning of the month on the back of rebounding global manufacturing activity and soaring Chinese demand.
With price now breaking out of several bullish continuation patterns on multiple timeframes, copper appears poised to continue its recent run higher as a strengthening fundamental backdrop begins to support positive price developments.

Copper Futures (HG) Monthly Chart – Symmetrical Triangle Break Ominous for Bears
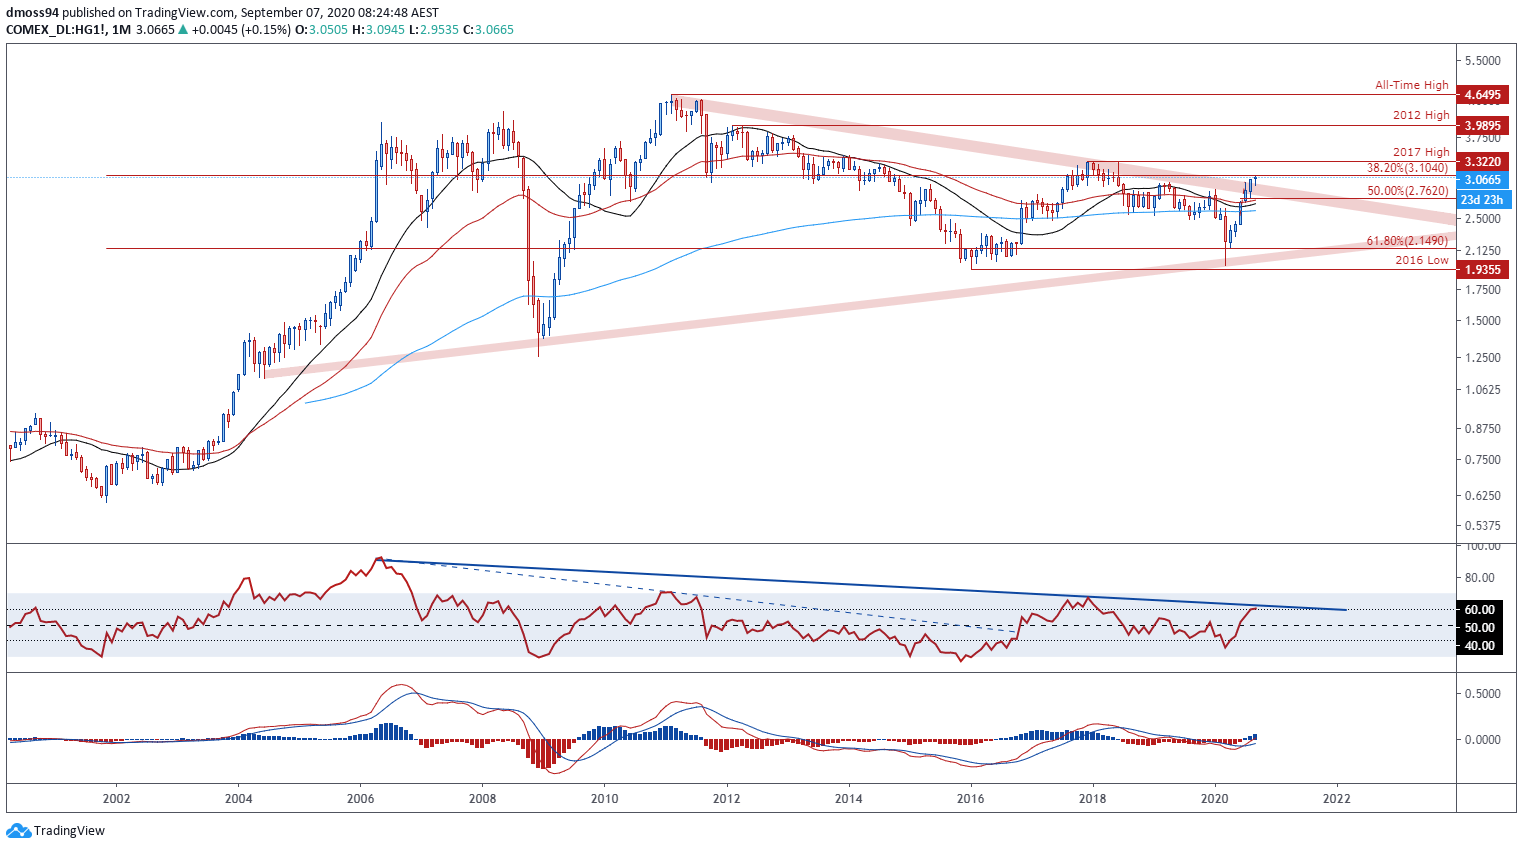
Copper Futures (HG) monthly chart created using TradingView
From a technical perspective, copper prices appear poised to climb higher after breaking above Symmetrical Triangle resistance.
However, the development of RSI hints at fading bullish momentum, as the oscillator struggles to break above 60 and the downtrend extending from the 2006 extremes.
Inability to close above key resistance at the 38.2% Fibonacci (3.1040) could generate a pullback towards the January 2020 high (2.8860), with a close below probably invalidating the topside break of Symmetrical Triangle consolidation.
Nevertheless, price continues to track above the 21-, 50- and 200-month moving averages, which suggests that the path of least resistance remains to the topside.
Therefore, if support at the psychologically pivotal 3.00 level remains intact further gains look more than likely.
Copper Futures (HG) Weekly Chart – ‘Golden Cross’ Implies Swelling Bullish Momentum
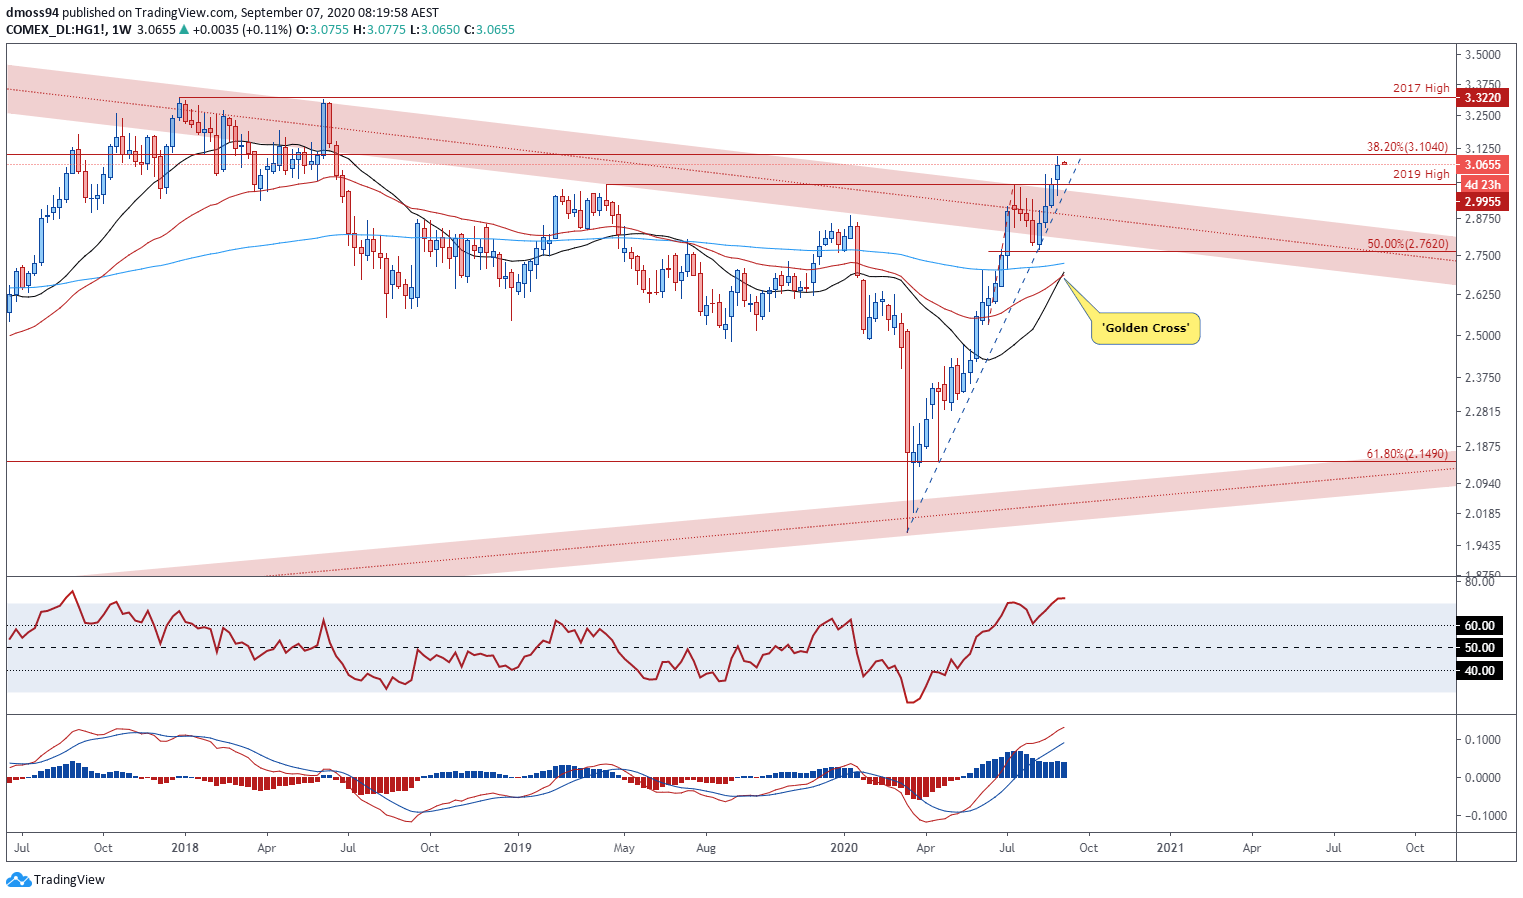
Copper Futures (HG) weekly chart created using TradingView
Zooming into a weekly chart reinforces the bullish tilt seen on the monthly timeframe, as the RSI and MACD indicators soar to their highest levels since August 2017.
A bullish ‘golden cross’ formation – the ‘faster’ 21-WMA crossing above the ‘slower’ 50-WMA – is indicative of swelling bullish momentum that may ultimately generate a sustained push above resistance at the 38.2% Fibonacci (3.1040).
A weekly close above key Fibonacci resistance would probably signal a resumption of the primary uptrend and could bring the 2017 high (3.3320) into play.
Conversely, if price breaks below confluent support at the 2019 high (2.9955) and yearly uptrend extended declines may be in the offing, with a break back below the psychologically imposing 3.00 level potentially inspiring a correction back to the sentiment-defining 200-WMA (2.7270).
Copper Futures (HG) Daily Chart – Long-Term Trend Break Hints at Further Gains

Copper Futures (HG) daily chart created using TradingView
That being said, scrolling into a lower timeframe indicates that copper prices may continue to track higher after surging away from the 21-day moving average (2.9515) on September 4.
The topside break of the Bull Flag continuation pattern in mid-August suggests that the ductile metal could push to its highest levels in seven years, with the implied measured move indicating price could climb above the 2017 high (3.32) in the coming weeks.
Moreover, the RSI and MACD indicators appear to be trending higher and could inspire further buying in the coming days if price clambers above the yearly high (3.0945).
A daily close above the 38.2% Fibonacci (3.1040) is needed to validate bullish potential and carve a path for copper to test the 100% Fibonacci (3.2310), with a daily close above the 3.25 level opening the door to fulfil the bullish continuation pattern’s implied measured move (3.3655).
-- Written by Daniel Moss, Analyst for DailyFX
Follow me on Twitter @DanielGMoss


