


Gold (XAU/USD) Analysis, Price and Charts
The price of gold looks likely to re-test the $2,000/oz. barrier again, fuelled by ongoing US dollar weakness with the DXY hitting a 28-month low in early trade. The weakness in the US dollar continues to be the main driver of gold’s price action and while this trend looks likely to continue, the slide lower in the greenback may slow in the short-term after hitting a 2-year+ low, dabbing the brakes on gold’s recent rally. The CCI indicator shows gold in heavily oversold territory, adding a note of caution.

US Dollar (DXY) Daily Price Chart (January – September 1, 2020)
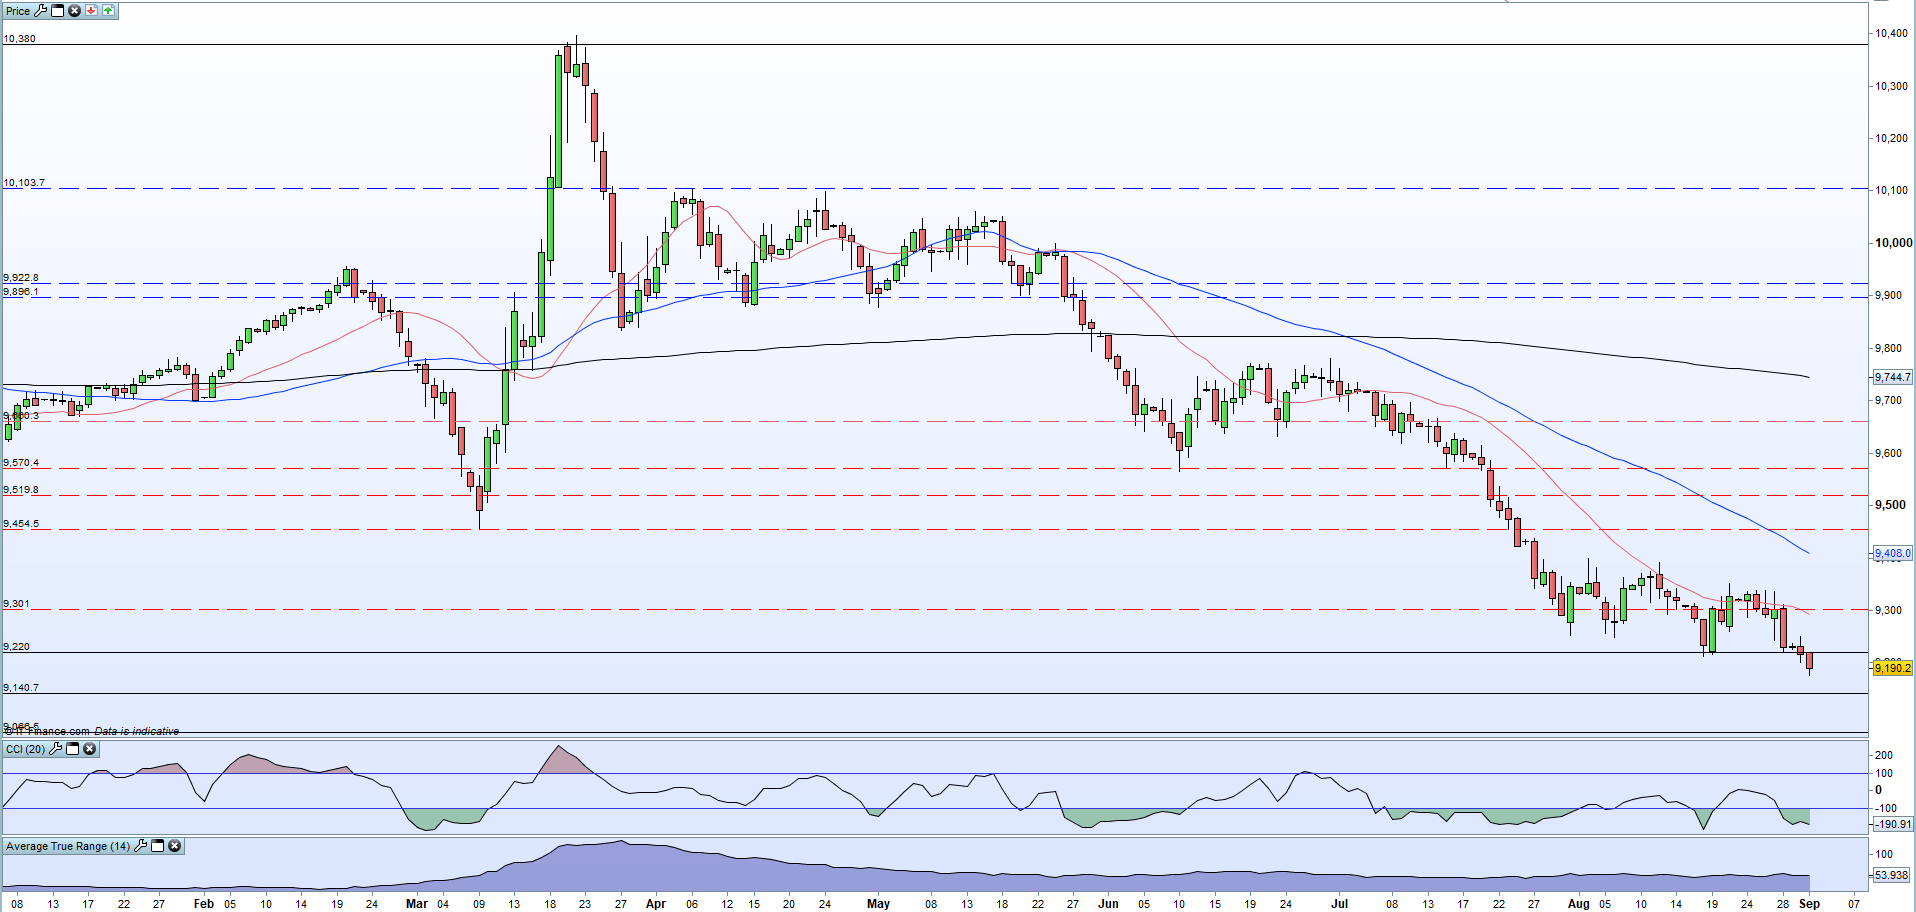
Gold continues to respect the positive trendline that started in late-March and has broken a series of short-term lower highs from the August 6 high. The precious metal is also back above the 20-dma, highlighting positive sentiment, while the CCI indicator is not yet in overbought territory although this looks likely to change in the coming days. Support is seen around $1,918/oz. from both trend and the 50-day moving average. Resistance currently at $2,000/0z. followed by two recent highs at $2,007/oz. and $2,016/oz.

Gold Daily Price Chart (January – September 1, 2020)


IG client sentiment shows 77.94% of traders are net-long with the ratio of traders long to short at 3.53 to 1.The number of traders net-long is 7.82% higher than yesterday and 3.16% higher from last week, while the number of traders net-short is 2.96% higher than yesterday and 8.45% higher from last week.
We typically take a contrarian view to crowd sentiment, and the fact traders are net-long suggests Gold prices may continue to fall.
Positioning is more net-long than yesterday but less net-long from last week. The combination of current sentiment and recent changes gives us a further mixed Gold trading bias.
What is your view on Gold – are you bullish or bearish?? You can let us know via the form at the end of this piece or you can contact the author via Twitter @nickcawley1.


